Customer journey mapping for small business is the practice of documenting every meaningful interaction a customer has with your company — from the first time they hear about you to renewal, referral, or churn — and pairing each interaction with the customer’s actions, questions, emotions, and friction points, so you can see where your business helps them and where you get in their way. Small businesses and B2B teams use it as a decision-making tool: it turns scattered anecdotes (“that lead ghosted us,” “onboarding is a mess”) into a single picture you can act on.
Here is the problem the top-ranking guides refuse to solve. NN/g, Qualtrics, Adobe, Miro, and Salesforce all publish long, well-written guides that assume you have a UX researcher, a CX team, a Miro subscription, and a workshop room full of stakeholders. You do not. You have a spreadsheet, a CRM, maybe a shared inbox, and about eight hours you can spare this month. You have heard the promise — organizations that manage the full customer journey see a 10 to 15 percent revenue increase and a 20 percent lift in customer satisfaction (McKinsey) — and you would like some of that, without spending three months on a project that will end up in a Miro board nobody opens. This article gives you the customer journey mapping framework that works at your scale: a four-branch, step-by-step build a small team can complete in a weekend, apply to B2B rigor (buying committee and renewal included), and keep alive without a CX department.
What Customer Journey Mapping Actually Is for a Small Business
A customer journey map is a visual, stage-by-stage record of what a customer does, thinks, feels, and struggles with as they move through your business — and, critically, what your business does at each of those moments. For a small business or a small B2B team, it is not a UX artifact. It is an operating document that answers three questions: where do customers get stuck, where do they get delighted, and where are we investing effort that customers do not value?
Every credible journey map captures five layers per stage. Stage is what the customer is trying to accomplish (for example, “figure out whether this vendor is credible”). Touchpoint is where the interaction happens (your website, an email, a sales call, a Loom demo). Action is what the customer literally does (opens the pricing page, replies to the email, forwards the demo). Emotion is what they are feeling on a rough scale from frustrated to delighted. Friction or opportunity is the gap between what they expected and what they got.
The definition of a customer journey map matters because small teams routinely confuse journey mapping with two other things: a sales funnel and a process map. A sales funnel counts conversions between stages. A process map documents what your team does internally. A customer journey map is different — it is written from the customer’s point of view and includes every stage, not just the ones that convert revenue. In practice, the highest-ROI insights in a small-business journey map come from the post-purchase stages that funnels ignore. 84 percent of customers say the experience a company provides is as important as its products or services (Salesforce State of the Connected Customer), and most of that experience is delivered after the sale — where a funnel stops looking.
One more clarification worth setting up front: you do not need a “customer journey map” for every customer type. A useful small-business map focuses on one persona in one scenario at a time. If you serve two different buyer types with genuinely different journeys — say, one-person consultancies and 50-person agencies — that is two separate maps, built one at a time, not a single Frankenstein diagram. This is the same guidance NN/g gives their enterprise clients, and it applies just as strictly at your scale.
The Five Customer Journey Stages for Small B2B Teams (and Why the B2C Version Fails You)
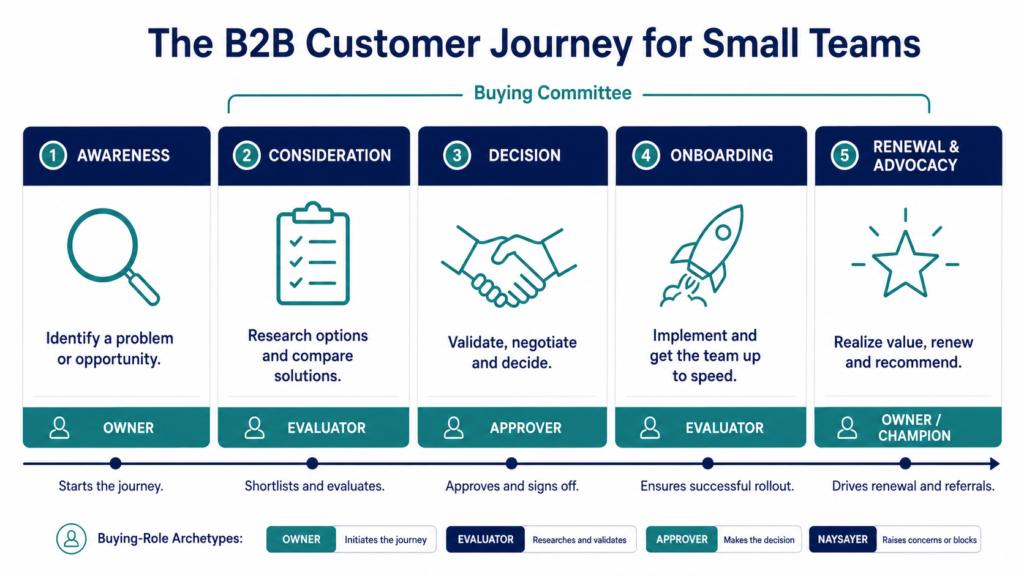
For a small B2B business, use five stages: Awareness, Consideration, Decision, Onboarding, and Renewal & Advocacy. Every stage carries specific customer actions, decision criteria, and internal owners — and every stage is a place where a small team can win or lose the customer without ever knowing it.
The common five-stage B2C model (Awareness, Consideration, Decision, Retention, Advocacy) breaks in B2B for two reasons. First, retention in B2B is not passive — it is an active onboarding-plus-adoption phase where the customer is deciding, all over again, whether they made the right call. Second, B2B decisions rarely involve one buyer. The typical B2B buying decision now involves 13 internal stakeholders and 9 external influencers (Forrester, State of Business Buying 2026) — meaning the “decision” stage in a B2C map is actually a months-long committee process in yours.
Here is the difference between B2B and B2C mapping in one line: B2C maps a person moving through stages; B2B maps a group of people moving through stages together, at different speeds, with different concerns. The Awareness stage still applies — someone Googles a problem, hears you mentioned on a podcast, or gets your name from a peer. Consideration is where they compare you against two or three alternatives, usually while showing screenshots to their team. Decision is a committee negotiation. Onboarding is where they either extract value in the first 30 days or start quietly regretting the purchase. Renewal & Advocacy is where the entire economics of a B2B business is either won or lost.
What are the five stages of the customer journey? For a small B2B team, they are Awareness, Consideration, Decision, Onboarding, and Renewal & Advocacy. Each stage needs its own set of touchpoints, actions, emotional signals, and friction notes — and the map is only useful when every stage is filled in, not just the pre-sale ones. If you already have a “customer journey map” but it stops at Decision, you have a marketing funnel, not a journey map.
A quick tour of what each stage actually looks like on the customer journey map for a small B2B team. Awareness is short and low-cost: the customer names a problem out loud, googles it, asks a peer, or notices your name in a newsletter. Your job at this stage is to show up in the two or three places they are actually looking, and to answer the specific version of their question, not the generic one. Consideration is where the customer first shortlists you against alternatives, and it is where the buying committee begins to form; the champion (usually the Owner archetype in your journey mapping framework) starts pulling in an Evaluator or two. Decision is the negotiation and buying-committee alignment phase; a small team wins here by making it embarrassingly easy for the champion to defend the choice internally — one comparison page, one Loom answer to the most common Naysayer objection, one references list.
Onboarding and Renewal & Advocacy are where small businesses have the largest untapped upside. Onboarding is a 30-to-90-day window where the customer decides whether they will keep paying you. Time-to-first-value is the master metric here: the faster a new customer gets a real, measurable outcome, the more forgiving they will be of everything else. Renewal & Advocacy is where retention, expansion, and referral all sit; a small B2B business that maps this stage properly will discover that its next ten customers were referred by its last three — and that shapes marketing spend more usefully than any awareness-stage analysis. Skipping either of these stages on the map is the single most common failure pattern we see, and it is one of the reasons enterprise-style journey mapping consistently underperforms for small teams: enterprise teams have separate CS and CX groups owning post-purchase, so their pre-sale map does not need to carry it. You do not have that luxury.
How to Map the B2B Buying Committee When You Only Have a Small Team
Mapping the B2B buying committee at small scale means listing the two-to-four roles that actually influence a purchase, and giving each role its own row on your journey map. You are not trying to name individuals — you are naming decision archetypes. For a typical small-B2B sale, three archetypes carry most of the weight: the Owner (who feels the problem), the Evaluator (who does the research and shortlists), and the Approver (who signs off on budget). For deals above roughly ten thousand dollars, add a fourth: the Naysayer (whoever raises the last-minute objection — usually finance or IT).
For each archetype, capture three things on the map: what they are trying to achieve, what they are worried about, and what would push them to say yes. This turns the buying committee from an abstraction into a coverage checklist. If your Consideration-stage content only speaks to the Owner, and the Evaluator is the one actually reading it, you now have a visible gap you can close with one blog post or one comparison page. This is the small-team version of Forrester’s stakeholder analysis: less rigorous, faster to build, and — for a two-person B2B team — far more likely to actually be used.
How to Create a Customer Journey Map Without a UX Researcher
How do you create a customer journey map step by step? Follow six steps: pick one persona and one scenario, sketch the five stages from memory, list the touchpoints in each stage, add customer actions and emotions per touchpoint, mark friction and delight moments, and validate with three-to-five real customer conversations. You do not need a UX researcher for any of this. What you need is the discipline to do one persona at a time and the willingness to be wrong on the first draft.
Step one — pick your persona and scenario. Choose the customer type that generates the most revenue today, and pick their most common purchase scenario. Not your dream customer. Not a hypothetical enterprise buyer. The one who paid you last month.
Step two — sketch the five stages from memory on a piece of paper or a fresh spreadsheet tab. This first draft will be embarrassing and that is the point. You are surfacing your current assumptions so you can test them.
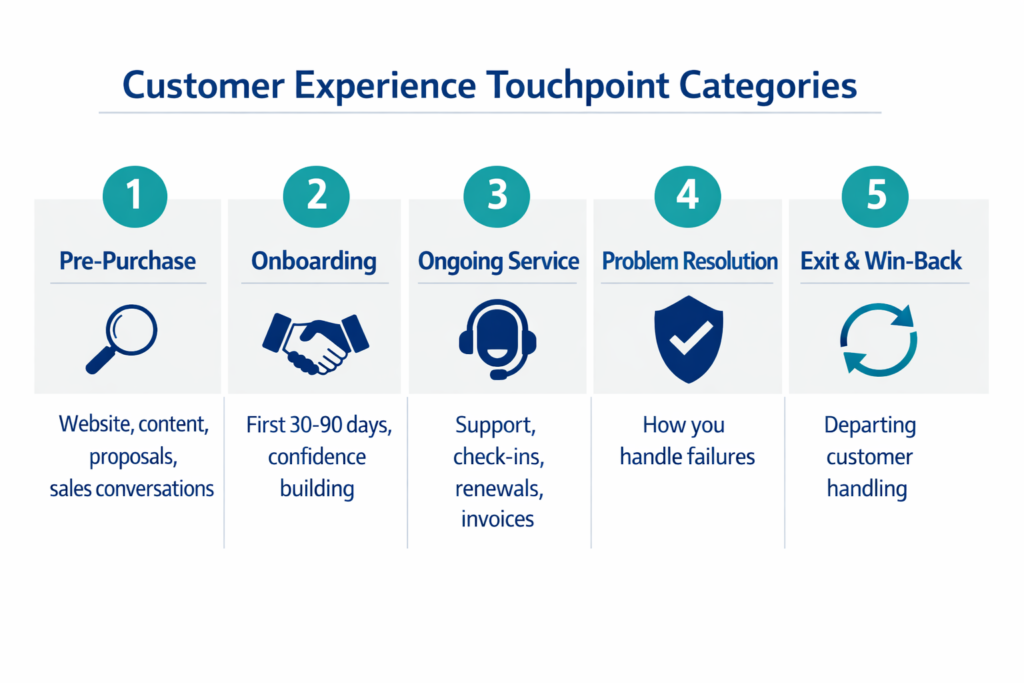
Step three — under each stage, list every touchpoint you can think of. A touchpoint is any place the customer interacts with your business: your website, a Google search result, a LinkedIn post, a sales call, an email, a demo, a contract, a Slack Connect channel, a monthly invoice. Do not filter yet. You will prioritise in step five.
Step four — for each touchpoint, fill in three columns: what is the customer doing here, what are they thinking or asking, and what are they feeling on a scale from 1 (frustrated) to 5 (delighted). This is where the map stops being a diagram and starts being a decision tool. If you cannot honestly fill in “thinking” and “feeling,” you have identified a research gap that step six will close.
Step five — mark friction moments in red and delight moments in green. Friction is anywhere the customer hesitates, drops off, or has to ask you the same question twice. Delight is anywhere they express relief, surprise, or gratitude. These are the two columns your future work will focus on: reduce friction, replicate delight.
Step six — validate. Call, video, or email three to five recent customers and walk them through your draft. Do not ask “does this look right.” Ask “walk me through what happened when you were choosing between us and [competitor].” The gap between your draft and their answers is your real map. This is the step most small businesses skip, and it is why most small-business journey maps end up decorative. The stakes on validation are worth naming: Bain famously found that 80 percent of companies believe they deliver a superior customer experience, while only 8 percent of their customers agree (Bain & Company, Closing the Delivery Gap). Skipping validation is exactly how you end up on the wrong side of that gap.
The Weekend Framework — Customer Journey Mapping in Under 8 Hours
The weekend framework compresses the six steps above into an eight-hour block a solo founder or a two-person team can complete on a Saturday. Hour 1: pick persona, sketch the five stages, list touchpoints from memory. Hours 2 to 3: pull the real data you already have — CRM notes, last 30 sales emails, last 20 support tickets, last 10 onboarding emails. Hours 3 to 5: fill in actions, thinking, and emotion columns for every touchpoint using that data. Hour 6: mark friction and delight in colour. Hours 7 to 8: schedule (do not hold — schedule) three 20-minute customer calls for the following week to validate the draft.
Eight hours gets you version one. The customer calls the following week get you version two. Version two is what you use for the next 90 days. That is the entire framework. A journey map does not need to be exhaustive to be useful — it needs to be honest, and it needs to exist.
How to Collect Customer Journey Data as a Small Business Owner
What data do you need for a customer journey map? At small-business scale, four sources give you 90 percent of what a UX researcher would collect at ten times the cost: CRM notes, sales-call transcripts, support tickets, and three-to-five customer interviews. You already own the first three. The fourth costs nothing but time. There is no need to buy journey-analytics software to get started — only 43 percent of the capabilities in adopted journey-analytics and orchestration tools are actually used (Gartner Market Guide), which tells you exactly how much of that stack you need on day one: none of it.
Start with CRM notes. Every CRM — HubSpot free, Pipedrive, Zoho, even a spreadsheet — has notes fields. Read the last 30 deals sequentially, ignoring your labels, and write down the questions prospects asked at each stage. You will see patterns emerge inside 15 minutes: the same objection three times, the same pricing question five times, the same integration ask twice.
Next, sales-call listening. If you record calls in Zoom, Loom, Fathom, Grain, or even a phone recorder, spend one hour listening to the last five discovery calls at 1.5x speed. Do not take structured notes — just capture the customer’s exact words. The verbatim quotes are gold. They will be the emotion-column entries on your map.
Third, support-ticket theming. Export the last 20 support tickets to a spreadsheet and tag each by journey stage (Onboarding, Adoption, Billing, Feature Request) and by root cause (Unclear, Broken, Missing). A tag pattern of “Onboarding + Unclear” showing up eight times is not a coincidence — it is a friction point on your map. Small-business “journey mapping tools free for small business” almost always start here: your existing ticket system plus tags.
Fourth, and only after the first three are done — customer interviews. Interviews are the corrective lens on the other three sources. CRM notes tell you what your sales team heard filtered through their own words. Call recordings tell you what the customer said in a sales context. Support tickets tell you where things break after the sale. Interviews tell you what the customer thought and felt while it was happening — the middle column of your map that no automated data source can fill in. A customer journey mapping framework that skips this data-collection sequence — CRM, calls, tickets, interviews — will always feel thin, because it is built entirely on your assumptions instead of your customers’ words. It is worth budgeting one dedicated hour to each of these four sources before you touch the map itself.
If you are worried about journey mapping tools for small business, remember the sequence above uses tools you already own — CRM, video calls, ticket system, spreadsheet. Paid journey analytics tools become useful once you have a mapped, stable baseline and can afford to pay for granularity. Until then, the return on tool spend is close to zero, which is why the Gartner adoption figure earlier in this section is so telling: teams buy the software before they build the map, then never use most of the software they bought.
How to Interview Customers for a Journey Map Without a Research Budget
Customer interviews for a journey map at small scale should be 20 minutes, over video, with three-to-five recent customers, using six open-ended questions. Not focus groups. Not surveys. Just short conversations that turn assumptions into evidence.
The six questions are: (1) walk me through how you first heard about us; (2) what were you actually trying to solve; (3) who else was involved in the decision on your side; (4) what almost stopped you from choosing us; (5) what surprised you — good or bad — in the first 30 days; (6) if a friend asked you what we do, what would you say. Ask, listen, do not defend. Recording is optional; taking near-verbatim notes is not. Send a fifteen-dollar coffee card afterwards as a thank-you. Total cost per interview: your time plus fifteen dollars. Total insight per interview: usually more than a paid research report.
Customer Journey KPIs for Small B2B Teams Without Analytics Software
Customer journey KPIs for a small B2B team should be five metrics — one per stage — that you can track in a spreadsheet or your CRM without buying journey-analytics software. The temptation is to track twenty. Do not. If you cannot look at a KPI weekly and act on it, it is not a KPI, it is a decoration. Small teams win with a shortlist.
The five to track are: Awareness stage — organic-search click-through rate on your top three pages (from Google Search Console, free); Consideration stage — reply rate on outbound or demo-to-close rate (from your CRM); Decision stage — proposal-to-close ratio and average sales cycle in days (from your CRM); Onboarding stage — time-to-first-value in days, or first-response time on onboarding tickets (from your CRM or ticket system); Renewal & Advocacy stage — 90-day retention rate, and referral rate or Net Promoter Score (survey once per quarter with a single Google Form). Every one of these is free to track. Every one of these can be reviewed by a founder in under 15 minutes a week.
Two KPIs deserve special mention. Customer Effort Score (CES) — “How easy did we make it to get [outcome]?” on a 1-to-7 scale — is the single best small-team signal because it directly reflects friction, which is exactly what your journey map is designed to reduce. Time-to-first-value (TTV) is the second: measured from contract signature to the customer’s first genuine success moment, it predicts renewal better than almost any pre-sale metric. Together, CES and TTV give a small B2B team a two-number early-warning system for the post-purchase half of the journey — the half most competitors ignore. McKinsey reports a 15 to 20 percent reduction in service costs (McKinsey) once teams start systematically identifying and fixing this kind of friction — the small-business version of that is turning a bad CES score into a specific fix within two weeks.
How to Score Customer Journey Friction on a Spreadsheet
Journey friction scoring on a spreadsheet uses three columns per touchpoint: severity (1-5), frequency (1-5), and effort-to-fix (1-5). Multiply severity by frequency to get impact. Divide impact by effort-to-fix to get priority. Sort descending. The top three rows are your next 90 days of work.
Severity is how much this friction hurts the customer when they hit it. Frequency is how often they hit it — daily onboarding friction beats an annual renewal issue. Effort-to-fix is your honest estimate in developer-days or founder-hours. This scoring is deliberately blunt. It is not meant to be defensible in a boardroom — it is meant to force a small team to stop debating and start fixing. If your top-priority row is “onboarding checklist is unclear” and it scores 25 divided by 2, that is the friction you fix first, not the fancy analytics dashboard your Naysayer archetype asked for.
Common Customer Journey Mapping Mistakes Small Businesses Make
The five mistakes that kill small-business journey maps are: mapping too many personas at once, skipping post-purchase stages, treating the map as a document instead of a decision tool, building it in a tool nobody else on the team can open, and never validating with real customers. Every one of these is fixable in an afternoon.
Mistake one: over-personas. A small team maps five personas in parallel, does none of them well, gives up. Fix: pick one persona, ship, then add the second next quarter.
Mistake two: pre-sale bias. The map stops at Decision. But McKinsey reports a 25 to 90 percent increase in profitability from customer-experience improvements (McKinsey) — and most of that upside is in Onboarding and Renewal. If your map ends at Decision, you have painted half a house. Fix: extend to Renewal & Advocacy even if the post-sale detail is thin at first.
Mistake three: the map as decorative artifact. You spend a weekend building it, print it, hang it, and never look at it again. Fix: schedule a 30-minute journey-map review at the end of every month; walk it before any product or marketing decision.
Mistake four: tool lock-in. Beautiful Miro board, gorgeous Figma diagram — but the salesperson cannot access it and the founder does not open it during a Zoom call. Fix: build in Google Sheets or Excel. Ugly beats invisible.
Mistake five: no validation. You built the map from memory and never talked to a real customer. Fix: five 20-minute calls, six questions, before the map goes into decisions. This one mistake — the one everybody knows and nobody does — separates journey maps that generate revenue from journey maps that generate PDFs.
A Free Customer Journey Map Template for Small Business and B2B
A free customer journey map template for a small business and B2B team needs seven columns: Stage, Persona/Buying-Role, Touchpoint, Customer Action, Customer Thinking, Emotion (1-5), and Friction/Delight Note. That is it. One row per touchpoint, grouped by stage. Google Sheets, Excel, or Notion — anything you can share with a link. Ungated. Editable. Openable on a phone.
Aberdeen Group research on companies that formalise their journey management is worth naming here: businesses with journey-management programs see 54 percent greater return on marketing investment and 56 percent more cross-sell and up-sell revenue (Aberdeen, via McorpCX). Those numbers are enterprise-scale, but the mechanism is the same at your scale: a clear map surfaces which touchpoints deserve investment, which do not, and where the cross-sell conversations are already trying to happen.
Column definitions matter, so here they are once and for all. Stage is one of the five (Awareness, Consideration, Decision, Onboarding, Renewal & Advocacy). Persona/Buying-Role identifies which archetype the row applies to (Owner, Evaluator, Approver, Naysayer). Touchpoint is where the interaction physically happens (page URL, email subject line, call type, ticket queue). Customer Action is a verb + object (“downloads pricing PDF,” “forwards demo Loom to CFO”). Customer Thinking captures a near-verbatim quote or paraphrase from your customer interviews. Emotion is a 1-to-5 score; anchor 1 as frustrated, 5 as delighted, and be honest at 3. Friction/Delight Note is one sentence naming what is happening at that touchpoint and what you might do about it.
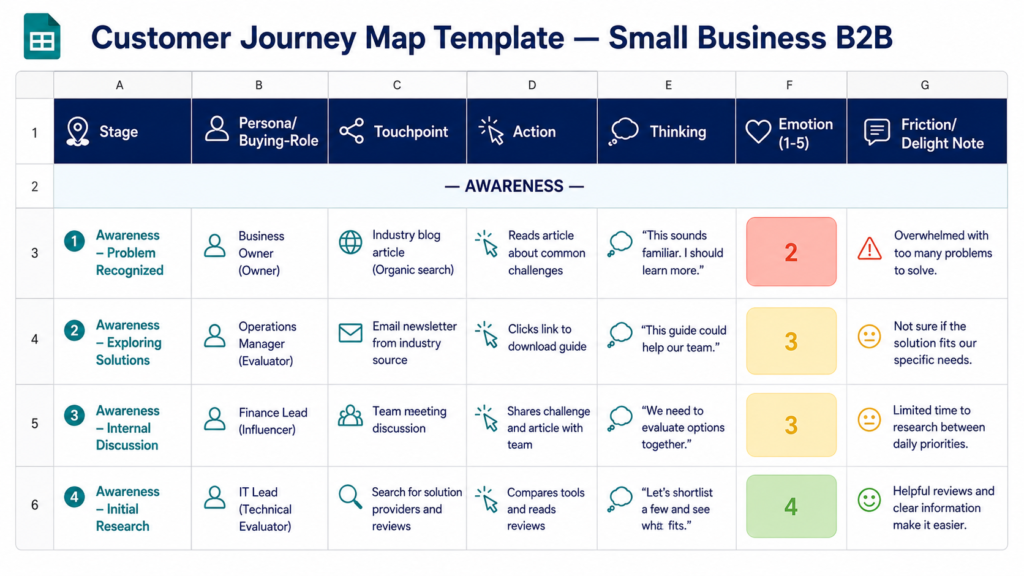
Add three optional columns once the base is stable: KPI (which of the five KPIs above measures this stage), Owner (who inside your team is accountable — for a solopreneur, that is always you, but naming it forces the discipline), and Next Action (the specific fix, with a due date). At that point, your spreadsheet has quietly turned into a small-business CX operating system. Some competitors will tell you that you need to level up into a dedicated journey-analytics platform. Ignore that for now. Customer journey map examples for small B2B teams consistently show that the spreadsheet-based version delivers 80 percent of the insight of the enterprise tools, at zero cost. Move to a paid platform only when your team hits ten people or you outgrow a single tab.
How to actually structure the sheet: create one tab per persona (start with one, add later), one row per touchpoint, colour-fill the Emotion column on a red-yellow-green gradient, and freeze the top row so you can scroll the map horizontally without losing headers. Group rows by Stage using bold section headers (“— AWARENESS —”) every ten rows or so, and use Google Sheets’ native filter view so you can isolate a single stage on demand. If you are more comfortable in Notion, the same seven columns map cleanly to a Notion database with Stage as a select field — the format is negotiable, the columns are not. The reason this template beats fancier tools is not aesthetics; it is that a spreadsheet is the only journey mapping format your sales team, your VA, and your future contractor can all open without a login. Ugly, universal, editable — those are the three properties that keep a map alive past week one.
How to Keep a Customer Journey Map Updated Without a CX Team
Maintain a customer journey map with a quarterly 90-minute review, a monthly 30-minute glance, and event-triggered updates when specific things change. You do not need a CX team to keep a journey map alive. You need a calendar invite that recurs.
How often should a customer journey map be updated? Quarterly at minimum, with a monthly glance to catch drift and an immediate update whenever any of these four events happen: you change pricing, you launch a new onboarding flow, you lose a customer whose feedback surprises you, or you gain a customer segment that behaves differently. Anything less frequent, and the map decays into a snapshot of a business that no longer exists.
The maintenance discipline is what protects the ROI of the initial build. Aberdeen also reports that companies with active journey-management programs drive over 2.5 times greater revenue from customer referrals (Aberdeen, via McorpCX) — but “active” is the operative word. A one-time journey mapping exercise loses most of its value within two quarters if nobody is updating it against a changing business.
The quarterly review is where the map earns its keep. Ninety minutes, one person, walking every stage: what changed, what got worse, what got better, what is new. The monthly glance is 30 minutes: are the five KPIs still trending the right way, and is any friction row now scoring so high it needs to jump the queue. Event triggers are the safety net: a pricing change alone can invalidate half of your Consideration-stage assumptions.
For a Spoke-of-CX-Hub reader, this maintenance cadence connects directly to broader customer-experience strategy work. If you want the parent playbook that puts journey mapping alongside VoC, NPS, and CX operating rhythm, see the CX Hub. If you are running the whole thing as a one-person business, our companion Spoke on customer experience strategy for solopreneurs shows how journey mapping fits inside a 90-day CX implementation plan.
Conclusion
Customer journey mapping for small business is not a UX exercise, a Miro workshop, or a consulting deliverable. At your scale, it is an operating document — one persona, five stages, seven columns, three-to-five customer interviews, a quarterly review — that pays for itself the first time it stops you from investing in the wrong touchpoint. Start with a spreadsheet, ship version one in a weekend, and treat every friction row as a work order. Customer journey mapping for small business, done this way, quietly becomes the operating rhythm the rest of your CX work hangs on. The customer journey mapping framework in this article beats the enterprise version at your stage because it can actually be finished, opened, and used. If you take one thing from this piece, take this: your first journey map should be honest before it is exhaustive, and it should exist before it is elegant. Everything else follows.
More from CorporatePlaybookPro.com
→ What is Customer Experience (CX): The Complete CX Playbook for Business Leaders
→ Customer Experience Strategy for Solopreneurs (2026 Guide)
→ B2B Customer Experience Strategy: A Playbook for CTOs and Business Executives
→ AI Customer Experience Adoption: A Guide for Leaders
→ Agentic AI for Customer Service: Keep the Human Touch
→ Voice-First Customer Experience: Why Conversational AI is the Future of Customer Service
→ Why Customer Centricity Should Drive Digital Transformation
→ How to Use Claude AI for Business: The Complete 2026 Guide
Frequently Asked Questions
Do small businesses really need customer journey maps?
Yes — but only if the map is going to be used, not decorated. A small business with under 20 customers a month may not need a formal map, but any small business making decisions about where to invest time or marketing dollars benefits from a one-persona, one-scenario map. The threshold is not company size; it is whether you can name the three friction points hurting you most this quarter. If you cannot, you need a map.
How much does customer journey mapping cost for a small business?
For a small business or B2B team, customer journey mapping costs between $0 and $75 in direct expense — that is coffee-card thank-yous for three to five customer interviews and, optionally, an inexpensive whiteboard tool. The real cost is time: budget one weekend for version one, then 90 minutes per quarter to maintain it. Any vendor quoting five figures for a small-business journey map is selling you an enterprise deliverable you will not use.
What tools do you need for customer journey mapping?
At small-business scale, you need four things you already own: a spreadsheet (Google Sheets or Excel), your CRM notes, your support-ticket system, and a video-call tool for interviews. Dedicated journey mapping tools like Miro, UXPressia, or Smaply become useful once you have five or more people editing the map simultaneously — until then, a spreadsheet keeps the map open, editable, and universally accessible.
How long does it take to create a customer journey map?
A first version of a small-business customer journey map takes about eight hours of focused work — one weekend for a solopreneur, or a shared workday for a two-person team. Validating that draft with three to five customer interviews adds another five to six hours the following week. So plan on roughly two weeks calendar time to go from blank sheet to a map you would defend to a partner.
What is the difference between a customer journey map and a process map?
A customer journey map is written from the customer’s point of view and captures what they think, feel, and struggle with at each stage. A process map is written from your team’s point of view and captures what your business does internally to fulfil an order or resolve a ticket. Both are useful, but they answer different questions — journey maps surface customer-facing friction, process maps surface operational friction. Most small businesses need both, one at a time, starting with the journey map.
Can you build a customer journey map in a spreadsheet?
Yes — and for a small business or B2B team, a spreadsheet is the recommended format. A seven-column layout (Stage, Persona, Touchpoint, Action, Thinking, Emotion 1-5, Friction/Delight Note) in Google Sheets or Excel delivers the same decision-making value as a Miro or Figma diagram at zero cost, and is far more likely to actually be opened and edited over time by a non-designer team.
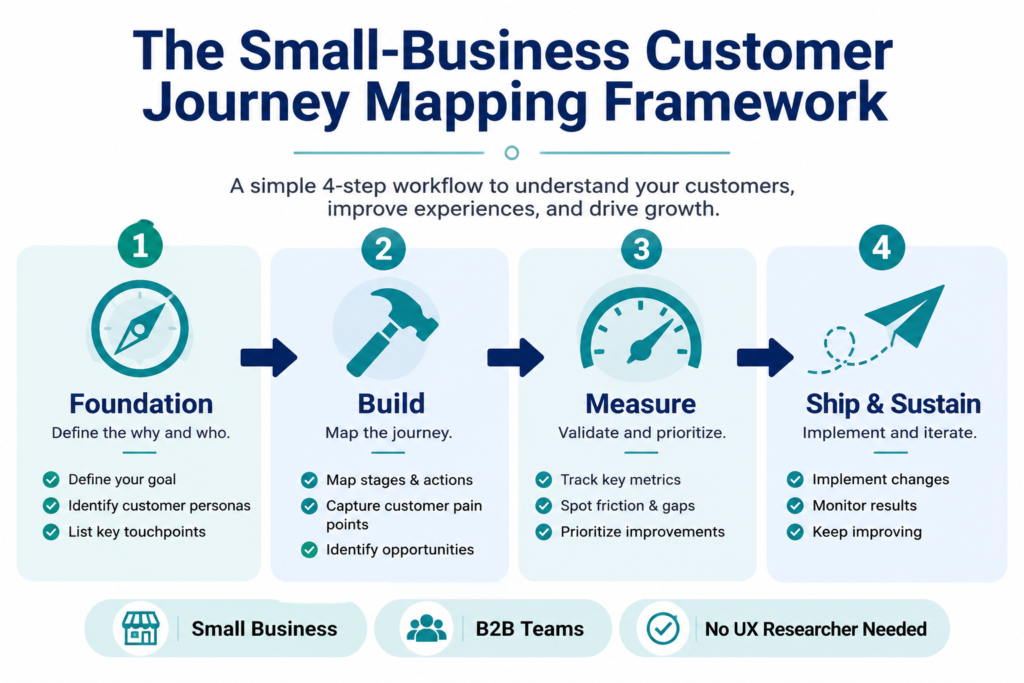
How do you build a customer journey mapping framework that works without dedicated researchers?
Follow a four-branch customer journey mapping framework: foundation (define stages and personas from CRM data), build (draft the map in a spreadsheet using memory plus existing sales-call and support-ticket data), measure (attach one KPI per stage that your CRM already tracks), and ship-and-sustain (validate with 3-5 customer interviews, then review quarterly). No dedicated researcher needed — the framework replaces UX headcount with structured use of data you already own.
What is a lightweight customer journey mapping template that a two-person B2B team can actually complete?
A lightweight template for a two-person B2B team uses seven columns — Stage, Persona/Buying-Role, Touchpoint, Action, Thinking, Emotion (1-5), Friction/Delight — and one row per touchpoint, grouped by the five journey stages. A two-person team can populate this template in about eight hours by pulling data from CRM notes, the last 30 sales emails, and the last 20 support tickets before scheduling three customer interviews to validate the draft.
How do you validate a customer journey map without a research budget when you are a solo founder?
A solo founder validates a customer journey map with three to five 20-minute video interviews with recent customers, using six open-ended questions covering discovery, initial problem, other decision-makers, near-misses, first-30-day surprises, and how they would describe your business to a friend. Total cost is a $15 coffee card per interview. The gap between your draft and their answers is the validated map — no research budget or agency required.
What is a customer journey map?
A customer journey map is a visual, stage-by-stage record of what a customer does, thinks, feels, and struggles with as they move through your business, paired with what your business does at each of those moments. It is written from the customer’s point of view, covers every stage from awareness through renewal, and functions as an operating decision tool — not a marketing artefact.
What are the stages of a B2B customer journey?
The stages of a B2B customer journey are Awareness, Consideration, Decision, Onboarding, and Renewal & Advocacy. This differs from the common B2C model by making Onboarding its own stage (a 30-90-day post-purchase window where retention is decided) and by recognising that the Decision stage in B2B is a months-long committee negotiation involving 13 internal stakeholders and 9 external influencers on average.
What KPIs should you track on a customer journey map?
Track five customer journey KPIs — one per stage — that your CRM or a spreadsheet can already measure: organic-search click-through rate (Awareness), reply-or-demo-to-close rate (Consideration), proposal-to-close ratio and sales-cycle length (Decision), time-to-first-value and first-response time (Onboarding), and 90-day retention plus referral rate or NPS (Renewal & Advocacy). Customer Effort Score is the highest-leverage single metric to add if you can only track one extra number.