A digital maturity assessment is a scored review of how far your organization has moved from manual, siloed work to connected, data-driven operations, rated across fixed dimensions such as strategy, customers, operations, technology and people. A digital transformation maturity assessment applies the same scoring to a change programme: it fixes your starting point, ranks your gaps and shows what to fix first.
Your leadership team keeps asking whether the business is “digitally mature,” and nobody can answer with more than a feeling. You have tried scoring yourselves: a vendor template, a workshop, a slide full of threes. Then the results sat in a folder while the same budget arguments carried on.
The common belief is that a digital maturity assessment framework is only a way to get a number. It is not. A useful one shows you which dimension is holding everything else back and what to do about it. That matters, because 70% of digital transformations fall short of their objectives (BCG), and the gap usually comes from sequencing and measurement, not from technology.
This guide gives you a complete digital maturity assessment framework you can run this week: 8 dimensions, 5 levels, 50 scored questions, one simple formula and an action list for every score range. Use it on paper, or let our free calculator do the arithmetic.
What Is a Digital Maturity Assessment Framework for Business?
So, what is a digital maturity assessment framework for business in plain terms? It is a structured way to score how far your organization has moved from manual, siloed work to connected, data-driven operations, and then to decide what to improve first. You answer a fixed set of questions, turn the answers into scores, and read the pattern. It is the practical core of any digital transformation effort, because it tells you where you stand before you spend.
A good digital maturity framework does three jobs. It gives you a shared language, so a CFO and a CTO mean the same thing by “Level 2.” It gives you a benchmark you can repeat every six months. And it turns a vague worry into a short list of gaps that someone can own. Without those three, an assessment is only a workshop.
The CPP digital maturity assessment framework in this guide is built for use, not for display. Every dimension has scored questions, every score range has actions, and the weights are adjustable so a retailer and a manufacturer do not get the same answer. Fewer than half of digital initiatives hit their targets: only 48% meet or exceed their business outcome targets, according to Gartner. A scored baseline is the cheapest way to improve those odds.
Digital Maturity Model vs Digital Maturity Assessment Framework
People often use the terms as if they were the same, so here is the difference. A digital maturity model vs digital maturity assessment framework comparison comes down to one point: the model describes, the digital maturity assessment framework measures and directs. The model is the map of stages. The framework is the map plus the survey, the scoring rules and the playbook.
| Digital maturity model | Digital maturity assessment framework | |
|---|---|---|
| What it gives you | Stage descriptions (for example, Exploring or Leading) | Stages plus scored questions, weights and a formula |
| How you use it | Read it and pick the stage that sounds right | Answer questions, calculate, read your profile |
| Output | A label | A score per dimension, an overall level and ranked gaps |
| Next step | Left to you | Actions matched to each score range |
| Repeatable? | Rarely, because opinions drift | Yes, because the questions and weights stay fixed |
The CPP digital transformation maturity model is the stage map inside our digital maturity assessment framework. You can read the stages without scoring anything, but you will get far more from running the full assessment. Our longer digital maturity assessment guide covers the wider research and benchmarks if you want the background.
Digital Maturity Assessment Model: How the CPP Model Compares With McKinsey and Deloitte
A digital maturity assessment model is the stage map behind the score, and the best-known models differ mainly in what they measure and how much work they leave to you.
The TM Forum Digital Maturity Model, a collaboration led by Deloitte, rates an organization across five dimensions: Customer, Strategy, Technology, Operations, and Culture, People and Organization. McKinsey’s Digital Quotient typically builds a profile from management surveys, interviews and operating evidence, then compares it with peers. Both are built to show where you stand against a reference point.
The CPP model adds what a self-run assessment needs: adjustable weights, a published formula and an action list for each score range. Use an external model when you need a peer benchmark. Use the CPP model when you need a repeatable internal baseline and a ranked list of what to fix.
Digital Transformation Maturity Assessment: Where It Fits in Your Roadmap
A digital transformation maturity assessment is the baseline you take before a transformation programme starts and repeat while it runs, so you can prove what changed.
Run it at three moments. Before you fund the programme, so the budget follows your lowest-scoring dimensions. At the halfway point, to check that the initiatives moved the scores they were meant to move. At close, to show the result. Your first score also sets the order of work, and our guide to digital transformation ROI shows how to turn each initiative into a measurable KPI.
Why Digital Maturity Assessments Rarely Lead to Action
Ask any manager who has been through one and you will hear the same story. Why digital maturity assessments rarely lead to action is not a mystery, and weak digital maturity assessment results are rarely the fault of the people involved: they fail in four predictable ways, and the CPP digital maturity assessment framework is designed around each one.
- They describe but do not diagnose. A page of level descriptions leaves you debating adjectives. Specific questions replace the debate.
- They stop at the score. You learn you are “Level 2” and you are on your own. Here every score range maps to actions.
- They flatten everything into one number. An average hides the single weak area that caps the rest. Here the profile matters more than the average.
- They assume enterprise scale. A 60-person company cannot build a transformation office. Here the actions have a first move that fits any size.
There is a fifth reason that is less discussed: nobody owns the output. The assessment is run by a project team, presented once and then handed to no one. The CPP method closes that gap with a final step that assigns a target, an owner and a first initiative to each priority dimension before the meeting ends. Keep those five reasons in mind as you read. When you reach the scoring steps, you will see each one handled directly.
Digital Maturity Dimensions and Levels in the CPP Model
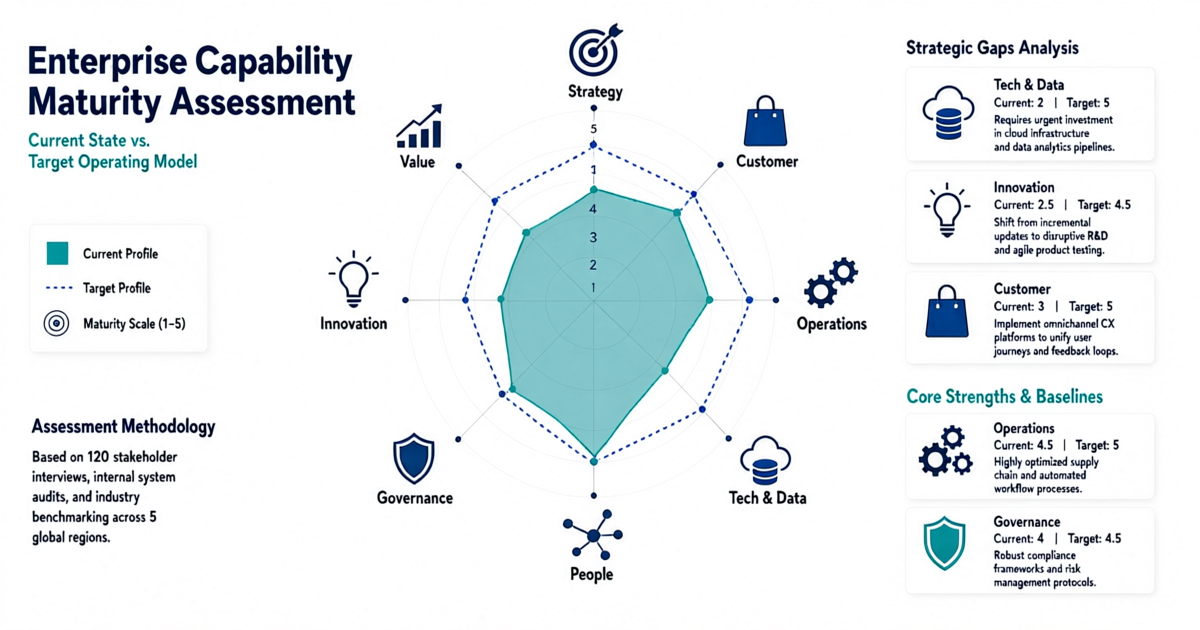
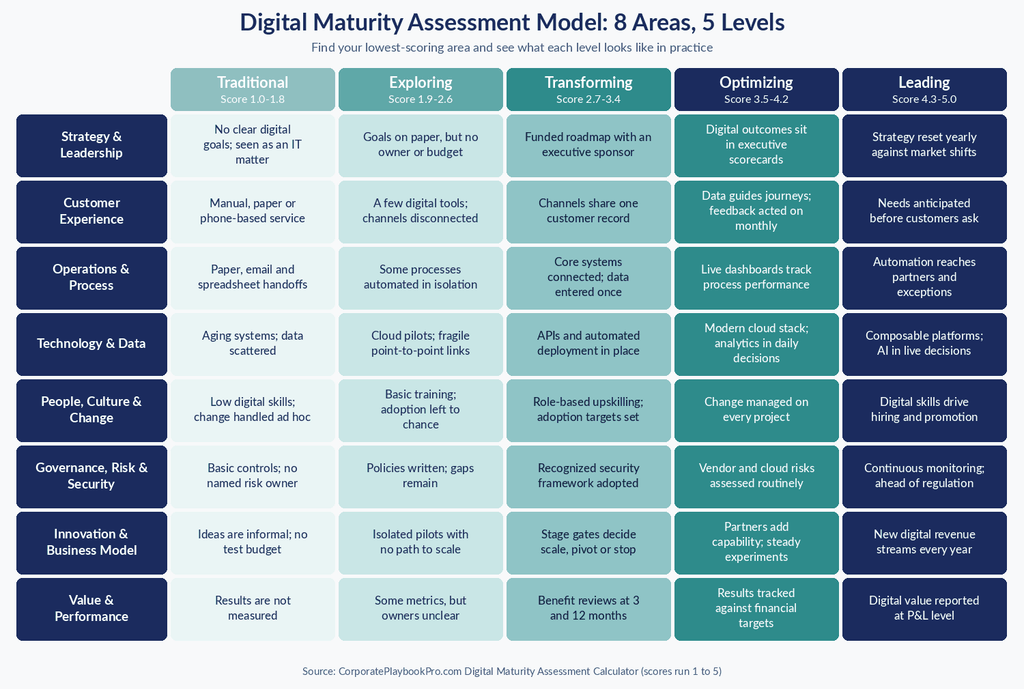
The digital maturity dimensions and levels work like a grid. The eight dimensions run down the side and describe what you are measuring. The five levels run across the top and describe how mature you are on each. Your assessment puts you in one cell per row, and the pattern of those cells is your profile. The digital maturity model dimensions are listed below with their default weights, which you can adjust before you score.
| # | Dimension | Default weight | The question it answers |
|---|---|---|---|
| 1 | Strategy & Leadership | 14% | Whether digital is tied to business goals, sponsored by executives, funded, and actively steered. |
| 2 | Customer Experience | 13% | How digitally easy, consistent and personal it is for customers to buy from, get served by, and stay with you. |
| 3 | Operations & Process | 13% | How far core processes are digitized, automated, connected and continuously improved. |
| 4 | Technology & Data | 18% | The architecture, cloud, delivery engineering and data foundation that every digital capability depends on. |
| 5 | People, Culture & Change | 14% | Whether your people have the skills, mindset and change support to adopt digital ways of working, not just receive new tools. |
| 6 | Governance, Risk & Security | 10% | The security, privacy, compliance and risk controls that keep digital operations safe, resilient and trusted. |
| 7 | Innovation & Business Model | 8% | Your ability to test new ideas, partner for capability, and create new digital products, services and revenue. |
| 8 | Value & Performance | 10% | Whether digital investment produces measured, attributable business results, and whether you act on them. |
Technology and Data carries the highest weight because every other capability rests on it. Governance, Innovation and Value carry less, but Governance works as a floor, since one serious breach can erase gains elsewhere. Treat the defaults as a starting point and adjust them in Step 2 of the method.
The 5 Digital Maturity Levels From Traditional to Leading
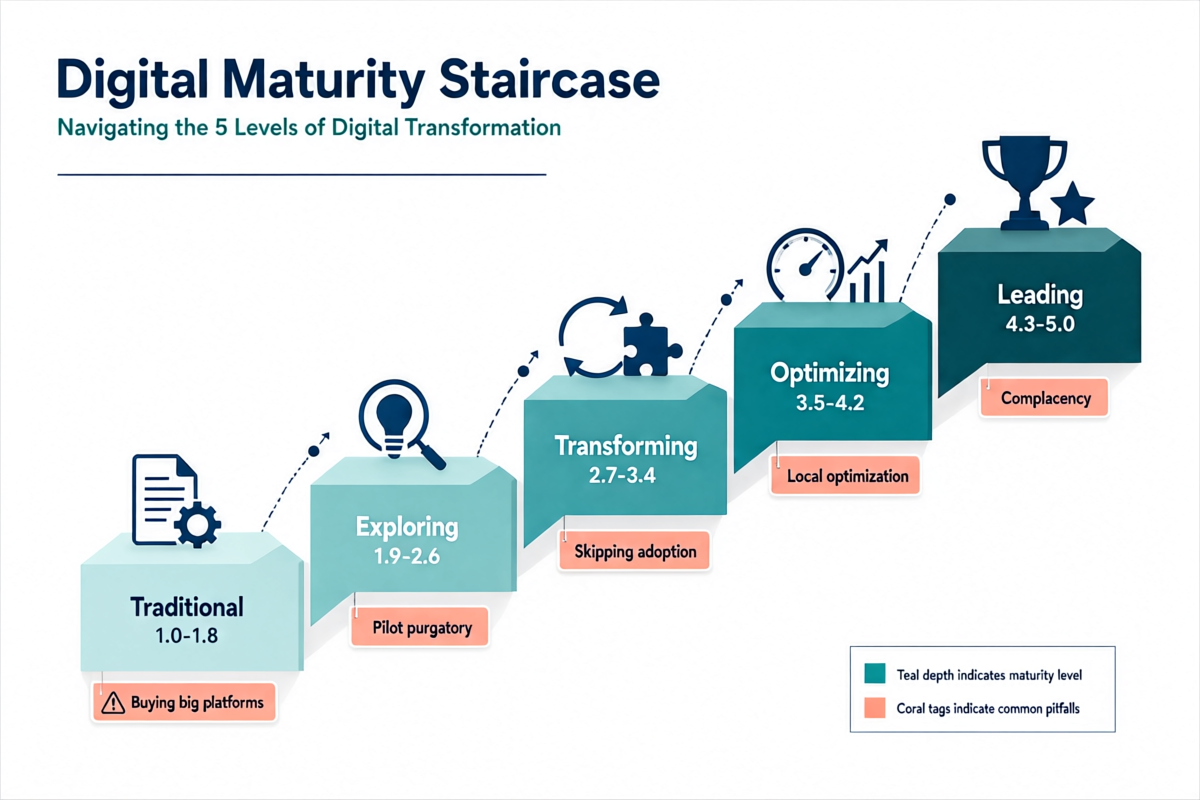
The digital maturity levels from traditional to leading are Traditional, Exploring, Transforming, Optimizing and Leading. Your weighted overall score maps to one of them, and each has a typical pattern and a typical trap. Learn to recognize both, because the trap is what keeps most organizations stuck.
| Level | Score range | What it looks like | The common trap |
|---|---|---|---|
| 1. Traditional | 1.0 to 1.8 | Work runs on email, paper and spreadsheets. Digital is “IT’s job.” No strategy, owner or measurement. | Buying a big platform to escape the mess, which digitizes the confusion. |
| 2. Exploring | 1.9 to 2.6 | Pilots and point tools exist, but they are isolated. Nobody can say what they delivered. | Pilot purgatory: more experiments, none scaled or stopped. |
| 3. Transforming | 2.7 to 3.4 | A funded roadmap, a named sponsor and connected core processes. Early benefits are documented. | Treating it as delivery only. Systems go live and adoption lags. |
| 4. Optimizing | 3.5 to 4.2 | Data guides decisions. Change is managed as a discipline. Value is tracked against financial targets. | Local optimization while the market shifts around you. |
| 5. Leading | 4.3 to 5.0 | New digital products and revenue streams launch regularly. Teams own outcomes end to end. | Believing the work is finished. Maturity decays without attention. |
Notice how the traps differ. At Levels 1 and 2 the danger is spending without foundations. At Level 3 it is declaring victory at go-live. At Levels 4 and 5 it is complacency. That is why the actions later in this guide change by level and not only by dimension. These five stages of digital maturity are also not a ladder you must climb in order for every dimension. Most organizations sit at different levels on different dimensions, and the uneven profile is the point.
What if your dimension scores straddle two levels? Go by the overall weighted score for your headline level, and by the individual dimension scores for decisions. A company with an overall 2.7 might have Strategy at 3.4 and Technology at 1.9. The headline says Transforming, but the plan should still treat technology as an Exploring-level gap with Exploring-level actions.
McKinsey found that only 16% of respondents said their transformations improved performance and sustained the gains, with the rate reaching 26% in high-tech and falling to between 4% and 11% in traditional industries (McKinsey, 2018). Those industry gaps are one reason the CPP model lets you adjust weights, which the next section covers.
Digital Maturity Assessment Weights by Industry
Digital maturity assessment weights by industry should reflect what your strategy depends on, and the framework lets you set them before you score. A weighted maturity score lets a hospital and a software company use the same questions but care about different dimensions. The defaults suit a typical mid-size business. Change them only when you can explain why, and always make the eight weights total 100%.
| Business type | Raise | Why |
|---|---|---|
| Retail or e-commerce | Customer Experience to 18-20% | Revenue depends on how easy it is to buy and return. |
| Financial services or healthcare | Governance, Risk and Security to 15-18% | Regulation and data sensitivity set the ceiling. |
| Manufacturing or logistics | Operations and Process to 18-20% | Margin sits in throughput, errors and delays. |
| Professional services | People, Culture and Change and Value and Performance | Delivery quality and proof of results win clients. |
| Startups and growth firms | Innovation and Customer Experience | Growth comes from new offers and fast learning. |
Agree the weights before anyone scores, and write them down. If you change them after you see the results, the score reflects what you wanted to see.
Digital Maturity Scorecard With 8 Dimensions and 5 Levels
This digital maturity scorecard with 8 dimensions and 5 levels is the one-page reference to keep open while you score. Read across each row and pick the description closest to your reality today. Where two columns fit, pick the lower one, as the scoring rules require. The digital maturity matrix below is also the quickest way to explain the framework to colleagues who have not read the rest.
| Dimension | 1 Traditional | 2 Exploring | 3 Transforming | 4 Optimizing | 5 Leading |
|---|---|---|---|---|---|
| Strategy & Leadership | No documented digital strategy. Digital is treated as IT’s job. No executive sponsor. | A strategy deck exists, but sponsorship rests on one champion and there is no funded roadmap. | Funded roadmap with named executive sponsor, owners, milestones and quarterly reviews. Business-case process in use. | Digital outcomes sit on executive scorecards. Employees can explain the strategy. Competitor benchmarking is routine. | Strategy is reset every year against market shifts. Digital shapes the business model, not just the operation. |
| Customer Experience | Journeys are unmapped. Service runs on phone, email and in person. Feedback is anecdotal. | A few self-service tasks exist online, but channels are disconnected and feedback is collected sporadically. | Core journeys are mapped. Key tasks can be completed online. A shared customer record is forming. Feedback is acted on within set timeframes. | Experience is consistent across channels. Personalization is live. CX metrics steer product and service decisions. | Customer needs are anticipated from real-time behavior. CX metrics are tied to team incentives. |
| Operations & Process | Work runs on paper, email and spreadsheets. Processes live in people’s heads. | Some processes are documented. Isolated automations exist. Data is re-keyed between systems. | Core processes are digitized and standardized. Systems behind the top processes are integrated. Cycle time is measured. | Live process dashboards. Partners and suppliers are digitally connected. Process owners improve with data. | Automation covers exceptions and cross-company flows. Process mining finds bottlenecks continuously. |
| Technology & Data | Legacy, on-premise, point-to-point systems. Data sits in silos with no owners. | First cloud workloads. Ad hoc integrations. Reports are assembled by hand. | An API or integration layer exists. CI/CD runs on key applications. Data owners and a catalogue are emerging. | Cloud scales on demand with cost control. Self-service BI works on governed, trusted data. | Composable architecture. Predictive and AI-driven insight is embedded in live decisions. |
| People, Culture & Change | Digital skills are scarce. Change means an announcement email. Leaders delegate technology decisions. | Pockets of skill. Training is ad hoc. Change plans exist only for the biggest projects. | Role-based upskilling is in place. Every major initiative has a change plan. Cross-functional teams deliver key work. | Adoption is measured and acted on. A digital champion network supports peers. Experimentation is tolerated. | Digital capability is part of hiring and promotion. Persistent product teams own outcomes end to end. |
| Governance, Risk & Security | Security is reactive. Nobody owns data or digital risk. Recovery has never been tested. | Basic controls are in place. Policies are written but not enforced. Recovery plans are untested. | A recognized framework is adopted. Risk owners are named. Critical systems have tested recovery plans. | Privacy is built in by design. Vendor and cloud risk is monitored. A review gate precedes every launch. | Controls are monitored continuously. Red-team testing is routine. Controls update ahead of regulation. |
| Innovation & Business Model | Ideas surface ad hoc. There is no experiment budget. Digital means digitizing what already exists. | Occasional pilots run, with no route to scale and no shared learning. | An idea intake process runs monthly. A ring-fenced experiment budget exists. Stage gates decide scale, pivot or stop. | Strategic partnerships extend capability. Technology scanning is quarterly. New digital services are launched. | At least one new digital revenue stream per year. The platform or data is opened to an ecosystem. |
| Value & Performance | No success metrics. Benefits are assumed, never checked. | KPIs exist for some projects. Benefits are rarely reviewed after launch. | Metrics and a business owner are set before funding. Benefits reviews run at set intervals. Executives see digital KPIs regularly. | Financial impact is quantified. Underperformers are fixed or stopped and funding is reallocated. Maturity is reassessed periodically. | Digital value is reported at P&L level with capital-investment rigor. Performance data decides the next wave of funding. |
How to Use a Digital Maturity Assessment Framework Step by Step
Here is how to use a digital maturity assessment framework step by step, from a cold start to a plan with owners. The digital maturity assessment process takes 60 to 90 minutes for a small group, or 15 to 20 minutes alone with the calculator. Follow the six steps of the framework in order and keep your evidence next to each score.
- Choose who scores and gather evidence. Pick four to eight people from different functions and collect one artifact per dimension.
- Set the weights. Start from the defaults, adjust for your business, and make them total 100%.
- Score every question. Rate all 50 from 1 to 5, choose the lower number when unsure, and note the evidence.
- Calculate dimension and overall scores. Average the questions per dimension, then apply the weights.
- Find the binding constraint and the priority gaps. Read the profile, not only the average.
- Agree targets and owners. Record a 12-month target, a named owner and a first initiative for each priority dimension.
Step 1 matters more than it looks, because agreeing what success means comes before scoring anything. Teams that skip it end up arguing about definitions halfway through: 3 in 4 organizations struggle to define what digital success looks like, according to Deloitte. Write one sentence per dimension on what a good score would mean for your business, then start. Every later step of the process is easier once those sentences exist.
Short on time? Run the 15-minute version. Each scorer answers only the first two questions in every dimension (16 in total), you average them, and you compare the result with the scorecard below. It will not replace the full 50 questions, but it will tell you which two or three dimensions deserve the full treatment. The next four sections explain the steps that need the most detail: who scores, the arithmetic and how to read the result.
Who Should Complete a Digital Maturity Assessment
Who should complete a digital maturity assessment? Not one person. A single scorer in a scoring session reflects one corner of the business and tends to rate optimistically. Ask four to eight people to score independently before you compare, drawn from these roles.
- An executive sponsor, who knows what was funded and promised.
- Someone from IT or data, who knows what is really connected.
- An operations lead, who knows where manual work still hides.
- A customer-facing manager, who hears the complaints first.
- An HR or learning lead, for skills, culture and adoption.
- A risk or compliance owner, if you have one.
A small business can use two or three people who run different parts of the company. The digital maturity assessment team does not need to be large. It needs to be varied. Where two scorers differ by two points or more on a question, discuss it, because that gap usually shows two parts of the company living in different realities.
How to Calculate a Weighted Digital Maturity Score: Worked Example
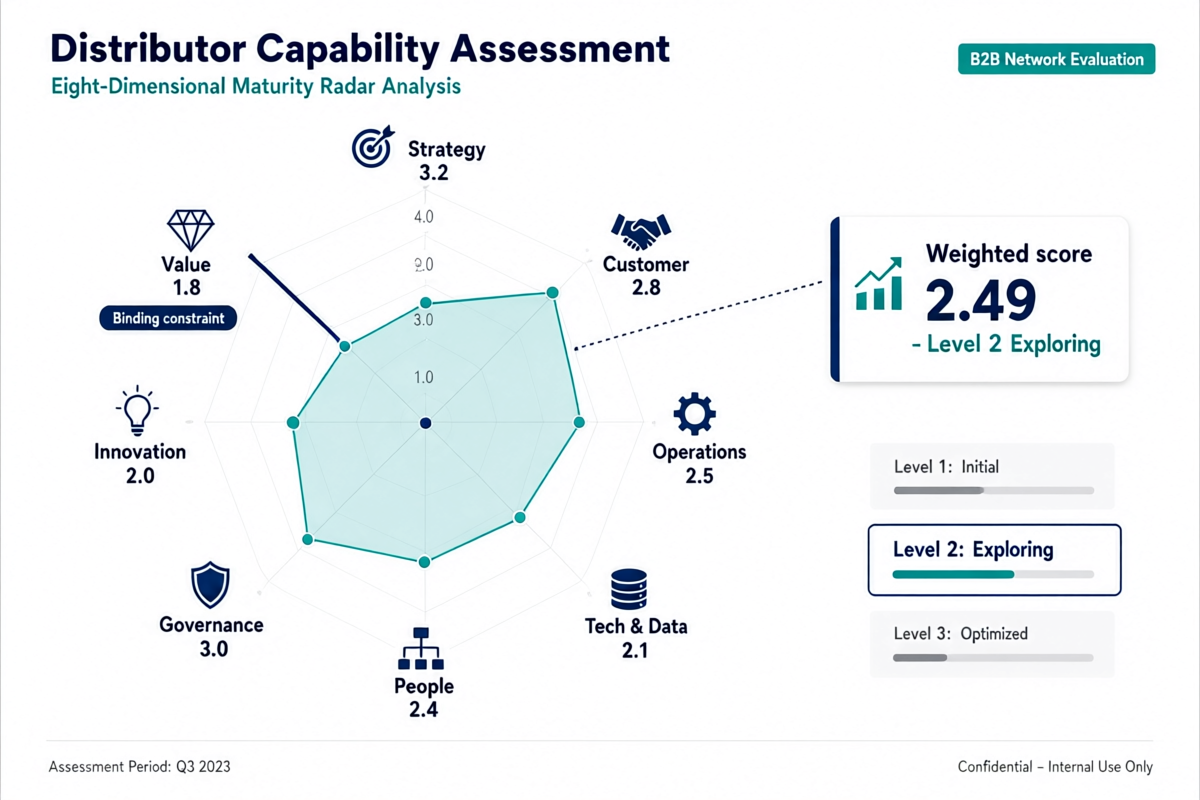
Here is how to calculate a weighted digital maturity score with this digital maturity assessment framework: you need only two formulas. The dimension score is the average of the question scores in that dimension. The overall score is the sum of each dimension score multiplied by its weight. The digital maturity score calculation below uses the default weights and illustrative scores for a fictional mid-size distributor.
| Dimension | Score | Weight | Contribution | Level on its own |
|---|---|---|---|---|
| Strategy & Leadership | 3.2 | 14% | 0.448 | Transforming |
| Customer Experience | 2.8 | 13% | 0.364 | Transforming |
| Operations & Process | 2.5 | 13% | 0.325 | Exploring |
| Technology & Data | 2.1 | 18% | 0.378 | Exploring |
| People, Culture & Change | 2.4 | 14% | 0.336 | Exploring |
| Governance, Risk & Security | 3.0 | 10% | 0.300 | Transforming |
| Innovation & Business Model | 2.0 | 8% | 0.160 | Exploring |
| Value & Performance | 1.8 | 10% | 0.180 | Traditional |
| Overall (weighted) | 100% | 2.49 | Exploring |
The distributor scores 2.49, which is Level 2, Exploring. The profile tells the better story. Strategy and Governance sit at Transforming, while Value, Innovation and Technology and Data sit at Exploring or below. This company knows where it is going and has controls in place, but it cannot yet connect its systems or prove results.
Three quick checks keep the arithmetic honest. First, every dimension score must fall between 1.0 and 5.0, so any value outside that range signals a typing slip. Second, your overall score must sit between your lowest and highest dimension scores. Third, the eight weights must total exactly 100%, or the overall score will drift. If your numbers pass all three, you can trust the result enough to plan on it.
Digital Maturity Gap Analysis to Find Your Binding Constraint
A digital maturity gap analysis to find your binding constraint takes five minutes once you have scores. In the CPP model, your binding constraint is your lowest-scoring dimension, because it usually limits progress everywhere else. In the example, Value and Performance at 1.8 means every investment is chosen on hope instead of evidence. Raising the ceiling with better technology will not help until that floor moves.
Then rank the rest. Pick a target score for each dimension (3.0 is a sensible first target), and calculate weight times the distance to target. The biggest numbers are where closing the gap lifts your overall score most. This digital capability gap analysis for the distributor looks like this.
| Rank | Dimension | Score | Weight | Weighted gap to 3.0 |
|---|---|---|---|---|
| 1 | Technology & Data | 2.1 | 18% | 0.162 |
| 2 | Value & Performance | 1.8 | 10% | 0.120 |
| 3 | People, Culture & Change | 2.4 | 14% | 0.084 |
| 4 | Innovation & Business Model | 2.0 | 8% | 0.080 |
| 5 | Operations & Process | 2.5 | 13% | 0.065 |
| 6 | Customer Experience | 2.8 | 13% | 0.026 |
| 7 | Strategy & Leadership | 3.2 | 14% | 0.000 |
| 8 | Governance, Risk & Security | 3.0 | 10% | 0.000 |
Technology and Data ranks first because of its 18% weight, with Value and Performance close behind. They are very different jobs. Value and Performance is a management routine (metrics, owners, reviews) that can start this month at almost no cost. Technology and Data is a multi-quarter build. Start both together: the cheap fix improves decisions now while the expensive one gets under way.
Digital Maturity Assessment Questions by Dimension
Digital maturity assessment questions by dimension are the engine of the digital maturity assessment framework: 50 statements, each scored from 1 to 5. A good digital maturity survey asks about evidence, not intentions, so answer for what exists and is used today. Use this one scale for every question.
- Traditional: not true at all (score 1).
- Exploring: true in pockets (score 2).
- Transforming: true for the core areas (score 3).
- Optimizing: true broadly and measured (score 4).
- Leading: true everywhere and continuously improved (score 5).
When you hesitate between two numbers, choose the lower one. Self-assessment skews optimistic, and a score you can defend with evidence is worth more than one that feels good. Each dimension of the assessment follows the same pattern: what it tests, the questions, a scoring tip, actions by score range, and a first move for the next 30 days.
Digital Strategy Maturity Assessment Questions
These digital strategy maturity assessment questions test whether digital is tied to business goals, owned by executives and funded as a priority. Treat them as a quick digital strategy assessment before you look at any technology. The gap between Level 2 and Level 3 is rarely the roadmap document. It is ownership and money: a roadmap with a named sponsor, a budget and quarterly reviews is a strategy, and one without them is a wish list.
- We have a documented digital transformation strategy tied directly to business goals and customer outcomes.
- Executive leaders visibly sponsor digital initiatives and own their results, rather than delegating them to IT alone.
- A funded, prioritized digital roadmap exists with milestones, owners and quarterly reviews.
- Digital investments are prioritized through a consistent business-case process, not by whoever pushes hardest.
- Employees at every level can explain our digital strategy and how it affects their work.
- We regularly benchmark our digital capabilities against competitors and adjust our strategy accordingly.
Scoring tip: If three or more of the six answers are a 1 or a 2, your Strategy score will land at Level 2 or lower, however many initiatives are running.
Low scores (up to 2.0): build the basics.
- Run a leadership workshop to agree 3 business outcomes digital must deliver in the next 18 months.
- Appoint a named executive sponsor with budget authority for digital transformation.
- Pick 2-3 high-visibility quick wins to build credibility and momentum within 90 days.
Middle scores (2.1 to 3.4): connect and scale.
- Turn the strategy into a funded 18-month roadmap with owners, milestones and quarterly executive reviews.
- Introduce a standard business-case template and scoring model for all digital investment requests.
- Benchmark against 3 direct competitors and identify the 2 biggest capability gaps.
High scores (3.5 and above): optimize and lead.
- Re-examine the strategy annually against market shifts and emerging technology, not just internal plans.
- Make digital outcomes part of executive scorecards and board reporting.
Your first move: Write the three business outcomes on one page, name the sponsor, and circulate it to your top 20 leaders. Watch out for: Confusing a strategy document with a strategy. If nobody can say who owns the roadmap and what it is funded with, you are at Level 2 no matter how good the deck looks.
Write your Strategy score into the scorecard before you move to the next dimension, with one line of evidence beside it.
Customer Experience Digital Maturity Assessment Questions
These customer experience digital maturity assessment questions show how easy it is to buy from you, get served by you and stay with you across every channel. A customer experience maturity model is only useful if it reflects what customers actually complete, so score adoption, not launches. The stakes are clear: nearly 90% of buyers say the experience a company provides matters as much as its products and services (Salesforce). At Level 1 and 2 the customer does the work, re-explaining problems and chasing status. At Level 4 context follows them between channels.
- We have mapped our customers’ end-to-end journeys and know where the biggest pain points are.
- Customers can complete core tasks (buy, pay, get support, track status) fully online or in-app without human help.
- Experience is consistent across channels (web, app, phone, in person), and customer context carries over between them.
- We collect customer feedback continuously and act on it within defined timeframes.
- We use customer data to personalize offers, communication or service.
- Customer experience metrics (NPS, CSAT, effort, digital adoption) are tracked and drive product and service decisions.
Scoring tip: Check adoption and completion figures before you answer questions 2 and 3. Score what customers use, not what you launched.
Low scores (up to 2.0): build the basics.
- Map the top 2 customer journeys end to end and list every manual step and drop-off point.
- Digitize the single most requested self-service task (e.g., order tracking, booking, or payment).
- Start collecting simple post-interaction feedback (CSAT or NPS) on every channel.
Middle scores (2.1 to 3.4): connect and scale.
- Connect channels through a shared customer record so context is not lost between web, app and support.
- Set a service-level target for acting on customer feedback and review it monthly.
- Pilot personalization on one touchpoint (email, product recommendations, or onboarding).
High scores (3.5 and above): optimize and lead.
- Use real-time behavioural data to anticipate customer needs before they contact you.
- Link experience metrics to team incentives and product prioritization.
Your first move: Call ten recent customers, walk through one journey with each, and list every point where they had to ask a human for help. Watch out for: Scoring yourself on what you offer rather than what customers actually use. A self-service portal that 8% of customers touch is a Level 2 capability.
Write your Customer score into the scorecard before you move to the next dimension, with one line of evidence beside it.
Digital Maturity Assessment of Business Processes: Operations Checklist
Use this digital maturity assessment of business processes to find where hours, errors and delays hide. Business process mapping starts with one question: where does someone copy data from one system into another? Every re-key is a delay, an error risk and a hidden cost. Level 3 organizations have implemented integration behind their top processes so data is entered once. Level 5 organizations extend automation to exceptions and to flows that cross company boundaries.
- Our core processes are documented, standardized and digitized end to end, with minimal paper, email or spreadsheet handoffs.
- Repetitive, rules-based tasks are automated through RPA, workflow tools or system integrations.
- Process performance (cycle time, error rate, cost per transaction) is measured in real or near-real time.
- Front-, middle- and back-office systems are connected, so work and data flow between teams without re-keying.
- Supply chain, procurement and partner interactions are digitally connected and visible.
- Process owners are accountable for results and continuously improve processes using data.
Scoring tip: Time one real process on five recent cases. If you cannot get the data without asking three people, question 3 is a 1 or a 2.
Low scores (up to 2.0): build the basics.
- Document your 5 highest-volume processes and flag every paper, email and spreadsheet handoff.
- Automate one painful, repetitive process with a workflow tool as a proof of value.
- Name an owner for each core process with a simple cycle-time and error-rate measure.
Middle scores (2.1 to 3.4): connect and scale.
- Integrate the systems behind your top processes so data is entered once and flows automatically.
- Build a live process-performance dashboard for the top 5 processes.
- Create an automation backlog ranked by hours saved and implement the top 3.
High scores (3.5 and above): optimize and lead.
- Extend automation to exception handling and cross-company processes with partners and suppliers.
- Apply process mining or analytics to find and fix bottlenecks continuously.
Your first move: Pick one process, time it from trigger to completion on five real cases, and count the handoffs. That single number usually opens the budget conversation. Watch out for: Automating a broken process. Digitizing a seven-approval workflow gives you a faster seven-approval workflow.
Write your Operations score into the scorecard before you move to the next dimension, with one line of evidence beside it.
Technology and Data Maturity Assessment Questions for a CTO
Use these technology and data maturity assessment questions for a CTO, or whoever owns your systems, to test the foundation under every other dimension. The enterprise data maturity model behind them rewards integration over rewrites and data with named owners. Getting it wrong is expensive: poor data quality costs organizations an average of $12.9 million a year (Gartner). This dimension has seven questions because it covers both technology and data.
- Our core applications run on modern, cloud-ready architecture, and legacy systems have a funded retirement or modernization plan.
- Systems integrate through APIs or an integration layer rather than point-to-point custom connections.
- Cloud and infrastructure scale on demand, with clear cost visibility and control.
- We release software changes frequently and safely through automated testing and deployment (DevOps / CI-CD).
- Data is governed, with clear ownership, quality standards, and a catalogue people can find and trust.
- Teams across the business can get trusted data through self-service analytics or BI without waiting on IT.
- Data and analytics routinely inform operational and strategic decisions, including predictive or AI-driven insights.
Scoring tip: Ask for evidence on question 4: how many times did you release to production last month, and how long did the last release take? “Quarterly releases” is a 2.
Low scores (up to 2.0): build the basics.
- Inventory your applications and rate each for business criticality and technical health to expose the legacy risk.
- Move one workload to the cloud as a controlled pilot and set a cost-tracking baseline.
- Name data owners for your top 5 data sets and agree basic quality rules.
Middle scores (2.1 to 3.4): connect and scale.
- Introduce an API or integration layer to replace the most fragile point-to-point connections.
- Automate testing and deployment for your highest-change application (CI/CD).
- Stand up a data catalogue and a self-service BI tool for the first two business units.
High scores (3.5 and above): optimize and lead.
- Retire remaining legacy platforms on a funded schedule and move to composable architecture.
- Embed predictive analytics and AI into live decisions, with monitoring to keep them reliable.
Your first move: List your top 20 applications on one sheet with an owner, a business-criticality rating and a technical-health rating. Red-rated critical systems become your modernization shortlist. Watch out for: Treating cloud migration as maturity. Lifting a legacy application into a cloud server changes the invoice, not the capability.
Write your Tech & Data score into the scorecard before you move to the next dimension, with one line of evidence beside it.
Digital Culture and Change Readiness Assessment Questions
These digital culture and change readiness assessment questions ask whether people have the skills, mindset and support to adopt new ways of working. A quick digital culture assessment looks at three things: skills, culture and change. Systems that go live but are not used deliver no value, and the research agrees: projects with excellent change management are 7x more likely to meet their objectives (Prosci). Our guide to digital transformation culture and change management goes deeper on this dimension. It also has seven questions.
- Leaders and managers have the digital literacy to make informed technology and data decisions.
- We have, or can reliably access, the digital skills we need (engineering, data, design, product, cybersecurity).
- Structured digital upskilling is available to all employees, and completion is tracked.
- Our culture encourages experimentation, tolerates small and fast failures, and shares lessons learned.
- Cross-functional business and technology teams deliver together using agile or product-based ways of working.
- Every major digital initiative has a change plan covering stakeholder engagement, training, communication and adoption targets.
- We measure whether people actually adopt new tools and processes, and we act when adoption lags.
Scoring tip: Question 7 is the revealing one. If you cannot quote an adoption percentage for your last major tool, score it a 1.
Low scores (up to 2.0): build the basics.
- Run a digital skills assessment and launch basic digital literacy training, starting with managers.
- Add a change and communication plan to every digital project before it starts.
- Create a small cross-functional team to deliver one visible digital win using agile methods.
Middle scores (2.1 to 3.4): connect and scale.
- Build role-based upskilling paths for priority functions and track completion.
- Set adoption targets (usage, completion, satisfaction) for each new tool and review them monthly.
- Create a network of digital champions across business units to support peers.
High scores (3.5 and above): optimize and lead.
- Make digital capability part of hiring, promotion and performance criteria.
- Move from project teams to persistent product teams that own outcomes end to end.
Your first move: Pull the 90-day usage numbers for the last tool you rolled out. If adoption is under 60%, you have just found your People score. Watch out for: Measuring training attendance instead of behavior change. A 100% completion rate on a course nobody applies is a vanity metric.
Write your People score into the scorecard before you move to the next dimension, with one line of evidence beside it.
Cybersecurity and Governance Digital Maturity Assessment Checklist
This cybersecurity and governance digital maturity assessment checklist covers the controls that keep digital operations safe, resilient and compliant. Digital governance maturity deserves attention beyond its 10% default weight because it works as a floor: the global average cost of a data breach reached $4.44 million in 2025 (IBM, via Help Net Security). The most common scoring error is rating the policy instead of the practice. A plan that has never been tested counts as untested.
- We have a defined cybersecurity framework (e.g., NIST, ISO 27001) with regular testing and executive reporting.
- Data privacy and regulatory compliance (e.g., GDPR, sector rules) are built into our digital systems by design.
- Clear ownership and decision rights exist for technology, data and digital risk.
- We have tested business continuity and disaster recovery plans for critical digital systems.
- Third-party, vendor and cloud risks are assessed and monitored.
- New technologies and digital initiatives go through a defined risk and architecture review before launch.
Scoring tip: Score the lower of “documented” and “proven.” A plan that has never been tested counts as untested.
Low scores (up to 2.0): build the basics.
- Run a baseline cybersecurity assessment and fix the top 5 critical gaps first.
- Assign a named owner for data protection and digital risk.
- Write and test a basic recovery plan for your 3 most critical systems.
Middle scores (2.1 to 3.4): connect and scale.
- Adopt a recognized security framework and report progress to executives quarterly.
- Introduce vendor and cloud risk assessments for every critical supplier.
- Add a lightweight security and architecture review gate before any new digital launch.
High scores (3.5 and above): optimize and lead.
- Move to continuous control monitoring and regular red-team or penetration testing.
- Track emerging regulation proactively and update controls ahead of enforcement.
Your first move: Ask your IT lead one question: when did we last restore a critical system from backup as a test? The answer tells you your real score. Watch out for: Scoring the policy instead of the practice. A recovery plan that has never been run is a hypothesis.
Write your Governance score into the scorecard before you move to the next dimension, with one line of evidence beside it.
Innovation Maturity Assessment for Digital Business Models
This innovation maturity assessment for digital business models measures your ability to test ideas, partner for capability and launch new digital offers. It carries the lowest default weight at 8% because it matters most once the foundations are in place. An innovation maturity model has one tell: do you stop things? An organization that never kills a pilot has no innovation process, only a pile of projects.
- We have a structured process to capture, test and scale new digital ideas from employees, customers and partners.
- A dedicated budget or capacity exists for experiments and pilots.
- We launch new digital products, services or revenue streams, not only digitize existing ones.
- We partner with startups, vendors or ecosystem players to access capabilities faster than we could build them.
- We systematically scan emerging technologies (AI, automation, IoT) and evaluate their business relevance.
- Successful pilots have a clear path to scale, and failing experiments are stopped quickly.
Scoring tip: Count the pilots started in the last 24 months and how many were scaled or formally stopped. Fewer than half resolved is a 2.
Low scores (up to 2.0): build the basics.
- Set up a simple idea intake and review process, with a monthly decision on which ideas to pilot.
- Ring-fence a small experiment budget (even 1-2% of the IT or ops budget).
- Run one 8-week pilot with a clear hypothesis and success measure.
Middle scores (2.1 to 3.4): connect and scale.
- Define stage gates that decide when pilots scale, pivot or stop.
- Build 2-3 strategic partnerships to access capabilities you lack.
- Assign someone to scan emerging technologies quarterly and brief leadership.
High scores (3.5 and above): optimize and lead.
- Launch at least one new digital revenue stream or business model each year.
- Open your platform or data to partners to build an ecosystem around your offering.
Your first move: List every pilot started in the last 24 months and mark each one scaled, stopped or still running. The ‘still running’ column is your innovation debt. Watch out for: Running pilots with no exit criteria. Pilot purgatory looks like activity and counts as Level 2.
Write your Innovation score into the scorecard before you move to the next dimension, with one line of evidence beside it.
Digital Value Realization and KPI Maturity Assessment
This digital value realization and KPI maturity assessment asks whether digital spending produces measured results that you act on. Benefits realization tracking is where most programs are weakest. 81% of organizations use productivity as a measure of digital ROI, yet few connect it to financial outcomes (Deloitte). The Level 3 marker is simple: every initiative has success metrics and a business owner before funding is approved. Our guide to measuring digital transformation ROI covers the formula and baselines.
- Every digital initiative has defined success metrics and a business owner before funding is approved.
- We track benefits realization after launch and compare actual results with the business case.
- Digital KPIs (revenue, cost, speed, customer, employee) are reported to the executive team regularly.
- We can quantify the financial impact of digital investments (cost savings, revenue growth, risk reduction).
- Underperforming digital initiatives are fixed or stopped, and the freed funding is reallocated.
- We assess our overall digital maturity periodically and use the results to guide investment.
Scoring tip: If you cannot name the three digital KPIs your executive team sees every quarter, question 3 is a 1 or a 2.
Low scores (up to 2.0): build the basics.
- Require success metrics and a named business owner on every new digital project request.
- Baseline 3 digital KPIs now so you can show improvement later.
- Review your 3 biggest recent digital projects and document what they actually delivered.
Middle scores (2.1 to 3.4): connect and scale.
- Introduce post-launch benefits reviews at 3 and 12 months for every major initiative.
- Build a single digital performance dashboard and review it with executives each quarter.
- Hold a portfolio review twice a year to stop or reshape low-return initiatives.
High scores (3.5 and above): optimize and lead.
- Report digital-attributed value at P&L level, with the same rigor as capital investment.
- Use performance data to decide where the next wave of digital funding goes.
Your first move: Take your three biggest digital projects from the last two years and write one line each: what was promised, what was measured, what was delivered. Watch out for: Reporting activity as value. Go-lives, licenses deployed and training sessions held are outputs. Value is cost out, revenue in, risk down.
Write your Value score into the scorecard before you move to the next dimension, with one line of evidence beside it.
What to Do at Each Digital Maturity Level
What to do at each digital maturity level depends on your overall score from the scorecard, because each level has a different theme and a different risk. Think of your level as the headline for the next 12 months and your dimension profile as the list of places to spend effort. A simple digital maturity roadmap follows below. Maturity pays off: MIT researchers found that the 26% profit advantage went to firms that combined digital intensity with strong transformation management, among nearly 400 executives surveyed (MIT Initiative on the Digital Economy).
To combine level and profile in the assessment, read your headline level first, then check each dimension against it. Any dimension more than one level below your headline is a candidate binding constraint, and the actions for that lower level take priority over the actions for your headline level. A Level 3 company with a Level 1 Governance score should fix governance before it scales anything else.
Traditional: A digital maturity assessment framework result at this level calls for one thing: get visible and win something quickly. The risk is paralysis or an oversized bet.
- Document your five highest-volume processes and mark every manual handoff.
- Name an executive sponsor and agree three business outcomes digital must serve.
- Digitize one high-friction task for customers or staff within 90 days.
- Baseline three KPIs now so improvement can be shown later.
- Run a baseline security check and fix the five most critical gaps.
Avoid: A large platform purchase before processes are documented and data has an owner.
Exploring: At this level the scorecard will show scattered strengths. Connect, own and measure. You have energy and pilots, and you need structure.
- Turn the strategy into a funded 18-month roadmap with owners and quarterly reviews.
- Introduce one business-case template and require metrics and an owner before funding.
- Integrate the systems behind your top two processes so data is entered once.
- Add a change and adoption plan to every initiative.
- Stop or scale every open pilot using simple stage gates.
Avoid: Starting more pilots instead of finishing the ones you have.
Transforming: Once the digital maturity assessment framework shows a funded programme, prove the value and lock in adoption. You have early wins, so convert activity into results.
- Run benefits reviews at three and twelve months for every major initiative.
- Build one executive digital dashboard and review it every quarter.
- Set and track adoption targets for every new tool.
- Stand up self-service analytics on governed data for two business units.
- Hold a portfolio review twice a year to reshape or stop low-return work.
Avoid: Declaring victory at go-live and moving on before adoption and benefits are secure.
Optimizing: A score this high in the digital maturity assessment framework means your operation is strong. Scale what works, look outward and extend reach.
- Extend automation to exceptions and to partner and supplier processes.
- Use real-time data to anticipate customer needs.
- Report digital-attributed value at profit-and-loss level.
- Test emerging technology on a protected budget and decide fast what to scale.
- Link digital metrics to executive and team incentives.
Avoid: Optimizing inside existing boundaries while the market moves around you.
Leading: Leaders in the digital maturity assessment framework still need a plan: compound the advantage, stay ahead and share the load.
- Launch at least one new digital product or revenue stream each year.
- Open data or platforms to partners to build an ecosystem.
- Move to persistent product teams that own outcomes end to end.
- Monitor controls continuously and prepare for regulation early.
- Reassess every six months to catch decay.
Avoid: Treating the score as permanent. Maturity fades without sustained attention.
Digital Maturity Assessment 30-60-90 Day Plan
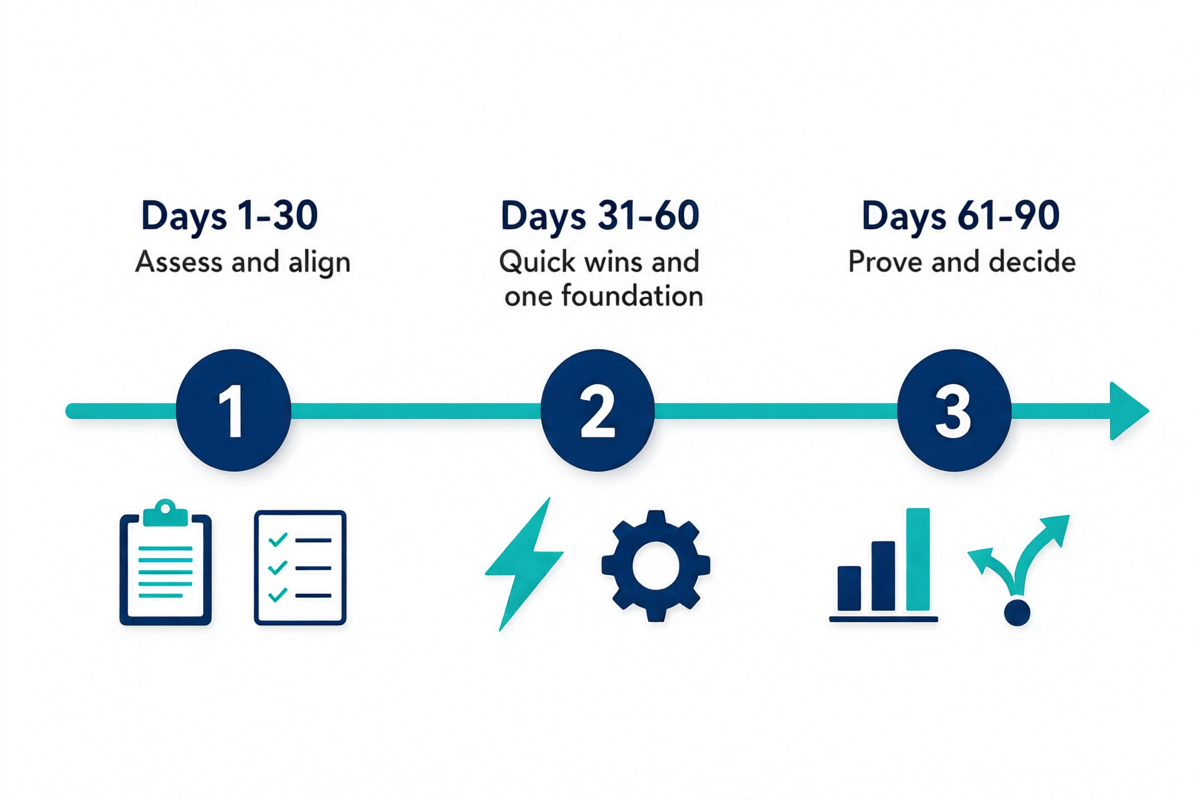
A digital maturity assessment 30-60-90 day plan turns your scores from the digital maturity assessment framework into an initiative roadmap that leadership can approve and people can start on Monday. The idea is to fix the cheap management gaps first, launch quick wins, and put one structural bet behind your binding constraint. Measurement matters here too: Deloitte found that organizations that measure digital progress holistically report about 20% more value from their efforts (Deloitte).
| Window | Focus | Outputs |
|---|---|---|
| Days 1 to 30 | Assess and align | Assessment completed with evidence. Weights agreed. Three priority dimensions chosen. Owners named. Three KPIs baselined. |
| Days 31 to 60 | Launch quick wins and one foundation | Two quick wins live, one customer-facing and one internal. Business-case template adopted. Foundation initiative for the binding constraint under way. Change plan in place. |
| Days 61 to 90 | Prove and decide | Adoption and early results reported against baselines. Pilots scaled or stopped at their gates. Next-quarter roadmap approved. Reassessment date set. |
Here is how the plan from the digital maturity assessment framework plays out for the distributor from the worked example. Its binding constraint is Value and Performance, its biggest weighted gap is Technology and Data, and its strongest areas are Strategy and Governance.
| Window | Initiative | Dimension | Owner | Success metric |
|---|---|---|---|---|
| Days 1 to 30 | Agree three digital KPIs and baseline them | Value and Performance | Finance director | Three KPIs reported monthly with baselines |
| Days 31 to 60 | Integrate order and finance systems so orders are entered once | Technology and Data | IT manager | Re-keying removed from the order process |
| Days 31 to 60 | Add an adoption plan to the new ordering portal | People, Culture and Change | Operations lead | Portal use by half of target accounts by day 90 |
| Days 61 to 90 | Review pilots at stage gates and stop two | Innovation and Business Model | Managing director | Every open pilot scaled or stopped |
Notice what the plan does not include: a new platform. At this score, the first quarter is about measurement, one integration and adoption. That sequencing is the main benefit of working from a profile instead of from a vendor demo.
For a deeper sprint template, see our 90-day digital transformation sprint. If you need a longer horizon, our guide on how to create a digital transformation roadmap picks up where this plan ends.
Digital Initiative Prioritization Template
Use this digital initiative prioritization template to rank the actions your digital maturity assessment framework scores point to. List every action for your three lowest dimensions, plus one or two for the strongest dimension you want to protect. You will usually have eight to twelve candidates. Score each on four criteria, then plot them on a simple impact effort matrix.
| Criterion | Question to ask | Scale |
|---|---|---|
| Impact | How many weighted points could this move, and does it unblock other work? | High, Medium, Low |
| Effort | How many people-weeks and how much budget, including change management? | Small, Medium, Large |
| Dependency | Does it need another initiative to land first, such as integrated data before analytics? | None, One, Several |
| Evidence | Can we show a result within 90 days? | Yes, Partly, No |
Then sequence with four rules.
- Foundations before features. Data ownership, integration and basic security come before analytics and advanced automation.
- Cheap management fixes first. Metrics, owners and reviews cost little and sharpen every later decision.
- Pair every technology initiative with a change plan. Adoption is part of delivery.
- Mix quick wins with one structural bet. Quick wins buy credibility. The bet moves the binding constraint.
Finally, write one initiative card per item so reviews stay fast and every initiative has an owner.
| Field | What to write |
|---|---|
| Initiative | One sentence, action first, such as “Integrate order and finance systems so orders are entered once.” |
| Dimension and score | Which dimension it improves and the current score. |
| Business outcome | The result in numbers: hours saved, cycle time, cost, revenue or risk. |
| Owner | One named person, not a team. |
| Metric and baseline | What you will measure and its value today. |
| Adoption plan | Who must change behavior, how they will be trained and how you will measure uptake. |
| Gate | The date and criterion at which you scale, pivot or stop. |
Digital Maturity Self Assessment Mistakes That Inflate Your Score
Digital maturity self assessment mistakes are mostly quiet ones: nothing breaks, the number simply comes out too high. Maturity assessment bias is real. In research covering 2,138 leaders across 18 countries, Cutter described a “digital detachment” in which senior leaders tend to overestimate the state of their transformation, and only 50% of leaders believe their culture supports it (Cutter). Avoid these seven errors when you run the digital maturity assessment framework and your score will be worth trusting.
- Scoring alone. One person’s view reflects one part of the business. Use a cross-functional group and let them score before they talk.
- Rating intent, not reality. “We plan to” is not a score. Score what exists and is used today.
- Averaging away the problem. A 3.0 overall can hide a 1.5 in Governance. Always read the whole digital maturity assessment framework profile.
- Changing weights after seeing scores. Fix them first, or the result reflects what you hoped to see.
- Skipping evidence. Opinion inflates. Attach one artifact to every dimension: a dashboard, roadmap or incident log.
- Treating it as a one-off. The first score is a baseline. The value arrives with the second and third.
- Stopping at the report. Without owners, targets and a first initiative, the assessment changes nothing.
If you only fix one, fix the evidence rule. It removes most of the optimism on its own.
Free Digital Maturity Assessment Calculator
Everything in this digital maturity assessment framework is built into a free digital maturity assessment calculator on our site. The digital maturity calculator walks you through four steps and returns your result in about 15 minutes.
- Profile: your role, industry and company size.
- Weights: adjust the eight dimension weights so they total 100%.
- Assessment: answer the 50 questions, one dimension at a time.
- Results: a radar chart, your weighted score and level, your strengths and priority gaps, an action roadmap and a path to the next level. You can print the results or email them to yourself.
Use the calculator for speed and this digital maturity assessment framework for depth. Complete the calculator first, then read the dimension sections for your two lowest areas to see the reasoning behind each score and the full set of actions. Our digital maturity assessment calculator page has the tool itself.
Digital Maturity Assessment Template: What to Copy Into Excel or Sheets
A digital maturity assessment template needs only four tabs, so you can run the framework before opening the calculator. Tab 1, Weights: the eight dimensions and their percentages, totalling 100%. Tab 2, Scores: the 50 statements with a 1 to 5 score, one evidence note and one scorer name per row. Tab 3, Results: the dimension averages and the weighted total from the worked example. Tab 4, Actions: the actions for your three lowest dimensions, each with an owner and a date.
Copy the structure, not someone else’s scores. If you would rather not build it, the free digital maturity assessment calculator is this template with the arithmetic built in.
How Often to Reassess Digital Maturity
How often to reassess digital maturity depends on how fast your business changes, but every six to twelve months is a good rule, and again after any major event such as an acquisition, a platform migration or a leadership change. Digital maturity tracking with the digital maturity assessment framework only works if the comparison is fair, so keep three records: the weights you used, the evidence behind each score and the initiatives launched in between.
Between assessments, watch four signals: adoption rate for each new tool, cycle time on your top processes, the share of initiatives with a baseline and owner, and the number of pilots scaled or stopped at their gates. If those four improve, your next score will too.
Your Next Step: From Digital Maturity Assessment Framework to Action
Digital maturity is not a badge. It is a way to decide where the next dollar, the next hire and the next quarter of leadership attention should go. The organizations that move fastest are rarely the ones with the most advanced technology. They know their profile, fix their binding constraint first, measure what they launch and reassess on a schedule.
Start with the digital maturity assessment framework above. Gather your scorers, set your weights, answer the 50 questions and find your two weakest dimensions. Pick one action from each, name an owner and put a review date on the calendar. That is a transformation plan, and it can begin today.
More from CorporatePlaybookPro.com
→ What Is Digital Transformation? The Complete Guide for Business Leaders
→ Digital Maturity Assessment Calculator
→ Digital Maturity Assessment: Benchmark Your Organization’s Transformation Readiness (2025 Guide)
→ Digital Transformation Frameworks Compared: Which Model Fits Your Business
→ Digital Transformation Culture and Change Management (2026 Guide)
→ How to Create a Successful Digital Transformation Roadmap: A Leader’s Guide
→ Digital Transformation ROI
→ The 90-Day Digital Transformation Sprint
→ Digital Transformation for Small Business
Frequently Asked Questions
What is a digital maturity assessment?
A digital maturity assessment is a scored review of how well your organization uses digital technology, data and ways of working. It rates areas such as strategy, customers, operations, technology, people, governance, innovation and value. The result is a score per area and an overall level that shows your strongest areas and your biggest gaps.
What is a digital transformation maturity assessment?
A digital transformation maturity assessment is a scored baseline of your digital capability, taken before and during a transformation programme. It shows which dimensions are weakest and what to fund first, and when you repeat it, whether the programme moved the scores it was meant to move.
What is a digital maturity assessment model?
A digital maturity assessment model is the set of stages that describes how far digital has spread through an organization, for example Traditional, Exploring, Transforming, Optimizing and Leading in the CPP model. The model describes the stages. The assessment framework adds the questions, weights and formula that tell you which stage you are in.
What are the levels of digital maturity?
The CPP framework uses five levels: Traditional (1.0 to 1.8), Exploring (1.9 to 2.6), Transforming (2.7 to 3.4), Optimizing (3.5 to 4.2) and Leading (4.3 to 5.0). Each describes how embedded digital is in the way you work, from manual and siloed to a source of competitive advantage.
How do you measure digital maturity?
Score a fixed set of statements from 1 to 5, average them for each dimension, then combine the dimension scores using weights that total 100%. The weighted result maps to a maturity level. The CPP framework has 50 statements, and our free digital maturity assessment calculator does the arithmetic for you.
What are the dimensions of digital maturity?
The CPP model uses eight: Strategy and Leadership, Customer Experience, Operations and Process, Technology and Data, People, Culture and Change, Governance, Risk and Security, Innovation and Business Model, and Value and Performance. Together they cover direction, delivery, foundations, people, protection and proof of results.
What is a good digital maturity score?
There is no universal good score. A weighted score of 2.7 or above (Level 3, Transforming) means digital runs as a funded programme with early benefits, which is a strong first target. Your best benchmark is your own previous score, measured with the same weights and questions.
How do I calculate a weighted digital maturity score?
Average the question scores in each dimension, multiply each dimension score by its weight as a decimal, and add the eight results. For example, a score of 2.1 in a dimension weighted at 18% contributes 0.378 to the total. Check that the weights add up to 100% before you start.
Who should complete a digital maturity assessment?
Four to eight people from different functions: an executive sponsor, someone from IT or data, an operations lead, a customer-facing manager, an HR or learning lead and a risk owner. Have them score independently first, then discuss any question where scores differ by two points or more.
How often should you reassess digital maturity?
Every six to twelve months, and after major changes such as an acquisition, a platform migration or a leadership change. Keep the same weights and questions each time so the scores stay comparable.
What are the most common digital maturity self assessment mistakes?
Scoring alone, rating intentions instead of what exists today, and skipping evidence are the biggest three. Others include averaging away a weak dimension, changing weights after seeing the results, treating the score as a one-off and stopping at the report. Attaching one piece of evidence to every dimension fixes most of them.
What is the difference between a digital maturity model and an assessment framework?
A digital maturity model describes the stages, such as Exploring or Leading. An assessment framework adds the scored questions, the weights, the formula and the actions for each score range. The model tells you what the stages look like. The framework tells you which stage you are in and what to do next.
Is there a free digital maturity calculator?
Yes. Our digital maturity assessment calculator is free and takes about 15 minutes. You choose your weights, answer 50 questions and get a radar chart, a weighted score, your level, your priority gaps and an action roadmap.
Can a small business use a digital maturity framework?
Yes. Use the same eight dimensions with two or three scorers, shorter evidence lists and adjusted weights. Small businesses often score well on customer experience and agility, and lower on governance and value measurement, which are inexpensive to improve.
How do I turn my score into a digital maturity roadmap?
List the actions for your three lowest dimensions, score each on impact, effort, dependency and evidence, and put foundations and cheap management fixes first. Then assign one owner per initiative and set a 30-60-90 day plan with a review date.