The single most powerful predictor of loyalty in B2B service relationships is not how satisfied your customers feel — it is how hard they had to work to get their problem resolved. Customer effort score is the metric that captures this reality directly, and in a B2B service environment, where accounts are worth multiples of consumer customers and friction accumulates invisibly across multi-stakeholder interactions, it may be the most consequential metric your service organization is currently ignoring.
This guide covers everything B2B service leaders and CX operations teams need to know: what CES is and why it was developed, how to calculate and interpret it in a B2B context, industry benchmarks with vertical guidance, the root causes of high effort, and a step-by-step implementation roadmap you can deploy in ninety days. If you want the broader customer experience framework this article feeds into, start with the Customer Experience Complete Playbook — CES is one spoke in that system.
What Is Customer Effort Score for B2B Service Leaders
Customer effort score for B2B service leaders is a single-question metric that measures how much work a customer had to expend to get a service interaction resolved. It is not a measure of satisfaction with an outcome — it is a measure of the friction involved in reaching that outcome. The distinction matters enormously in B2B contexts, where customer experience metrics B2B teams track most commonly (CSAT, NPS) routinely miss the operational friction that drives silent churn.
CES was introduced in 2010 by the Corporate Executive Board (now Gartner) in their landmark research published in the Harvard Business Review, titled “Stop Trying to Delight Your Customers.” The study found that 96% of customers who experience high-effort service interactions become more disloyal, while only 9% of customers in low-effort interactions do the same — a 10x asymmetry that upended conventional thinking about loyalty programs and delight strategies.
In its current form (CES 2.0), the metric uses an agree-disagree statement: “The company made it easy for me to handle my issue.” Respondents rate their agreement on a 7-point Likert scale. Lower scores signal higher effort — customers who disagreed found the process difficult. Higher scores indicate low effort — the interaction was easy to navigate.
For B2B service leaders, CES addresses a structural gap in most measurement programs: it captures the moment-level friction that NPS and CSAT survey at the wrong altitude. When an enterprise account contacts your support team three times before their issue is resolved, when they are transferred across four agents and have to re-explain context each time — NPS won’t catch this until the relationship sours enough to change the relationship score. CES catches it at the touchpoint, where intervention is still possible.

Customer Effort Score vs NPS vs CSAT in B2B Service
CES vs NPS vs CSAT is one of the most searched questions in CX measurement, and for good reason: organizations are frequently using the wrong metric for their use case. In B2B service contexts, the choice matters more than it does in consumer settings, because the stakes per account are higher and the feedback cycles are slower.
The table below maps the three metrics by diagnostic purpose, measurement timing, question format, and what each predicts:
| Metric | Diagnostic Purpose | Timing | Question Form | Predicts |
|---|---|---|---|---|
| CES | Friction in a specific interaction | Post-interaction (within 24h) | Agree-disagree on ease of resolution | Repeat contact, escalation risk, churn signal at touchpoint level |
| CSAT | Satisfaction with outcome | Post-interaction or periodic | “How satisfied were you with today’s service?” | Satisfaction with a specific outcome — not loyalty or renewal |
| NPS | Relationship health / advocacy | Periodic (quarterly, annually) | “How likely are you to recommend?” (0–10) | Overall relationship sentiment — not individual interaction quality |
The critical difference in B2B: NPS measures the relationship; CES measures the interaction. NPS tells you whether your account is at risk of not renewing in six months. CES tells you whether this week’s support ticket made them work harder than they should have. Both matter, but CES is the metric with an operational feedback loop — you can act on it in days, not quarters.
CSAT, meanwhile, suffers from a confound in B2B contexts: customers who are satisfied with the eventual outcome frequently do not reflect the effort it took to reach it. A customer who had to call three times but got their problem resolved correctly will often give a CSAT of 4 or 5 out of 5. Their effort score will tell a different story.
Research from Gartner indicates customer effort is 1.8× more predictive of customer disloyalty than satisfaction. In a B2B context where account lifetime values are measured in tens or hundreds of thousands of dollars, this predictive accuracy difference is not academic.
When to Use CES Instead of NPS for B2B Service Measurement
CES vs NPS B2B service decisions come down to what you are trying to learn and when. Use CES when you need post-interaction, operationally actionable data — after a support ticket closes, after an onboarding session, after a renewal conversation. CES gives you real-time friction intelligence you can act on immediately.
Use NPS when you want a relationship-level pulse at regular intervals — quarterly, after a major milestone, or as part of your executive business review preparation. NPS is a lagging indicator by design; CES is a leading one. The most effective B2B measurement programs run both: NPS quarterly at the account level, CES at every significant service touchpoint.
Where CES specifically outperforms NPS: in high-volume B2B support environments, post-onboarding (where first impressions set expectations for the entire relationship), and at renewal moments where friction in the preceding 90 days is directly correlated with expansion revenue decisions.
Customer Effort Score Formula and Calculation for B2B Organizations
The customer effort score formula for B2B organizations using CES 2.0 is straightforward: calculate the average of all responses to the standard CES question on a 7-point agree-disagree scale.
CES Formula (CES 2.0):
CES = Sum of all response scores ÷ Total number of responses
Example: 40 responses scoring 5, 6, or 7 (out of 7 scale) and 10 responses scoring 1–3 = CES of ~5.4
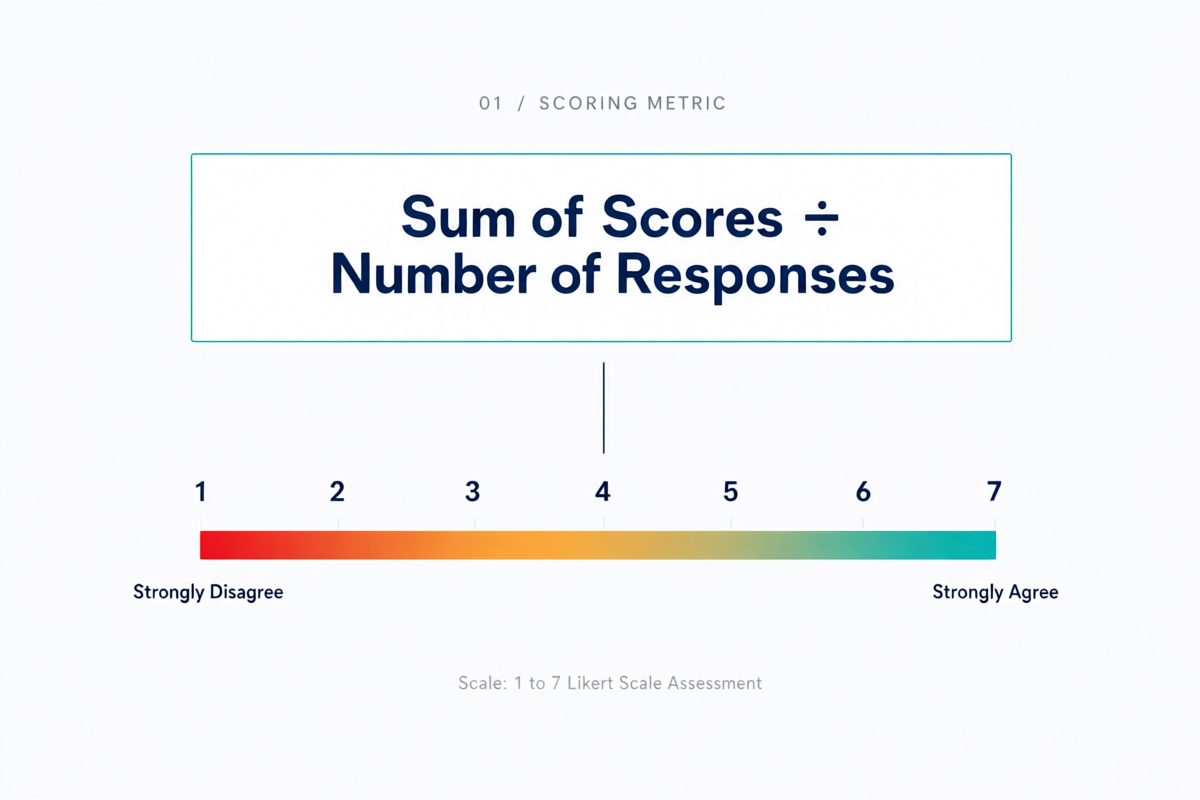
On the 7-point scale, higher scores are better — a score of 6.0 means respondents strongly agreed it was easy. A score of 3.0 indicates significant effort. Most B2B service organizations target a CES above 5.5 on the 7-point scale as a reasonable minimum, though vertical benchmarks vary (see Section 4).
In B2B organizations, the formula requires one important modification: weight enterprise-tier account responses separately from SMB responses. An aggregate CES of 5.8 can mask a pattern where your enterprise accounts — representing 70% of your ARR — are scoring 3.9 while your SMB segment scores 6.4. The aggregate score will never surface this crisis. Segment your CES calculation by account tier from day one.
CES 1.0 (the original 2010 version) asked “How much effort did you personally have to put forth to handle your request?” on a 1–5 scale where lower was better — a directional inversion that caused widespread confusion. CES 2.0 flipped this to the agree-disagree format (higher = lower effort) and is now the industry standard. If you encounter benchmarks from before 2013, they likely reflect CES 1.0 and are not comparable to current 7-point scores.
CES Survey Question Template for B2B Enterprise Accounts
CES survey questions B2B teams should use follow a standardized format, with B2B-adapted variants for different touchpoints. The standard CES 2.0 question is:
Standard CES Question: “The company made it easy for me to handle my issue.”
Scale: 1 (Strongly Disagree) → 7 (Strongly Agree)
B2B-adapted variants by touchpoint:
- Post-support ticket: “[Company] made it easy for me to resolve my support request.”
- Post-onboarding: “Our onboarding experience with [Company] was easy to navigate.”
- Post-renewal: “[Company] made the contract renewal process easy.”
- Post-self-service: “It was easy to find what I needed in [Company]’s knowledge base.”
Always follow your CES question with one open-text question: “What could have made this easier?” This follow-up is where your friction diagnosis lives. Quantitative CES tells you that effort was high; the open text tells you why. Do not skip it.
CES 7-Point Agree-Disagree Scale Setup for B2B Enterprise
CES survey scale options in B2B enterprise surveys should default to the 7-point agree-disagree format. Label all 7 points: 1 = Strongly Disagree, 2 = Disagree, 3 = Somewhat Disagree, 4 = Neutral, 5 = Somewhat Agree, 6 = Agree, 7 = Strongly Agree. Display numeric labels alongside text labels for clarity in enterprise survey contexts where respondents may be completing surveys quickly on mobile.
Research comparing scale formats in B2B enterprise survey contexts shows that 7-point scales provide better distributional sensitivity than 5-point scales — enterprise respondents differentiate more granularly when given 7 points, reducing clustering at mid-scale that artificially compresses your CES distribution and makes segment-level differences harder to detect.
B2B Customer Effort Score Benchmarks by Industry Vertical
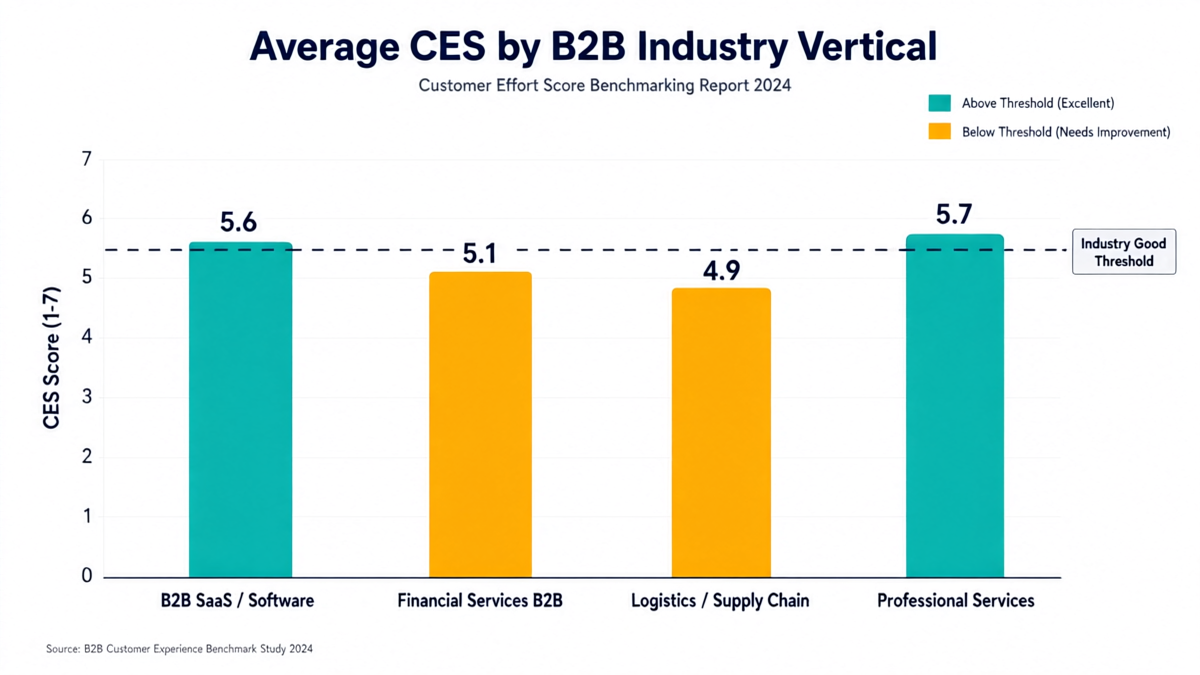
Customer effort score benchmarks must be interpreted in vertical context — a score that signals strength in B2B SaaS may indicate underperformance in professional services. The following benchmarks reflect published 2024–2026 industry survey data and should be treated as directional, not definitive, given variance in measurement methodology across organizations.
| B2B Vertical | Average CES (7-point scale) | Benchmark Range | Interpretation |
|---|---|---|---|
| B2B SaaS / Software | 5.4–5.8 | Below 5.0 = at-risk; Above 6.0 = excellent | Self-service capability significantly drives CES; knowledge base quality and in-app guidance are primary levers |
| Financial Services B2B | 4.9–5.4 | Below 4.5 = critical; Above 5.8 = leader | Compliance complexity and multi-approver processes structurally increase effort; strong onboarding and dedicated relationship support are the differentiators |
| Logistics / Supply Chain | 4.7–5.2 | Below 4.3 = at-risk; Above 5.5 = excellent | Exception management (delays, exceptions, disputes) is where CES collapses; proactive communication on exceptions is the highest-leverage intervention |
| Professional Services | 5.5–6.0 | Below 5.2 = at-risk; Above 6.3 = excellent | Higher baseline due to dedicated account management; CES measures project coordination and change-request friction more than support tickets |
What a “good” CES means on a 7-point scale: The industry convention is that scores above 5.5 are considered good, scores between 4.5 and 5.5 require attention, and scores below 4.5 signal material churn risk. These thresholds were established by Gartner’s original CES research and have been validated by practitioner surveys from Forrester and NICE inContact.
The most important caveat for B2B organizations: your aggregate CES conceals more than it reveals. Two organizations with identical CES of 5.4 can have completely different risk profiles. One may have a tight cluster of responses between 4.8 and 5.9. The other may have enterprise accounts scoring 3.5 while SMB accounts score 6.5 — the same average with radically different retention implications.
Enterprise vs SMB Account-Segment Benchmarks for CES
Customer effort score enterprise accounts systematically experience higher effort than SMB accounts in B2B service delivery — not because service quality is lower, but because enterprise interactions are structurally more complex. They involve more stakeholders, more approval chains, more customization requirements, and higher scrutiny of every touchpoint.
Set separate CES benchmarks for enterprise and SMB segments. A reasonable starting split: enterprise threshold at 5.0 (below which immediate CSM escalation is warranted), SMB threshold at 5.5. Do not mix these in your aggregate reporting. When you establish baselines in your pilot phase (see Section 9), baseline enterprise and SMB separately.
The concrete risk of ignoring this: if your enterprise segment represents 70% of ARR and is scoring 3.9 while SMB scores 6.2, your aggregate CES is approximately 4.7 — which reads as “needs attention” on most dashboards. In reality, you have a retention emergency in your highest-value cohort that demands immediate intervention. Aggregate CES, unexamined, will delay that discovery by weeks or quarters.
What Causes High Customer Effort in B2B Service Delivery
High customer effort causes in B2B service delivery fall into two categories: universal friction sources and B2B-specific structural causes. Both must be understood to build an effective reduction strategy.
Research from Gartner shows that customers who experience high-effort service interactions are 4× more likely to be disloyal, and that 62% of high-effort experiences involve multiple contacts to resolve a single issue — meaning the most common form of high effort in B2B service is not resolution quality, it is resolution speed and contact repetition.
Universal friction sources — present in both B2C and B2B:
- Repeat contacts for the same issue — the single strongest driver of high CES scores
- Channel switching — being forced from chat to phone to email to get resolution
- Escalation chains — multiple-agent handoffs without context continuity
- Information repetition — having to re-explain context at every escalation point
- Slow resolution — issues that extend beyond expected SLA windows
- Policy friction — inability to resolve because of internal policy constraints that don’t flex for account context
B2B-specific structural friction causes — higher-impact in enterprise accounts:
- Multi-stakeholder coordination burden — the customer’s team has to loop in IT, finance, and legal on their side to progress a simple service request
- SLA opacity — customers don’t know where their issue sits in the queue or when to expect resolution
- CSM-to-support handoff friction — accounts that know their CSM find themselves re-onboarding to a support queue with no warm handoff
- Onboarding complexity accumulation — early friction during onboarding sets a negative effort baseline that colors all subsequent interactions
- Contract and procurement friction at renewal — approval chains and re-negotiation rituals that should be frictionless for existing customers
Multi-Stakeholder Friction in B2B Accounts — How to Identify CES Drivers
B2B account friction measurement presents a challenge that does not exist in B2C: a single account has multiple stakeholders experiencing different interactions, different levels of effort, and different friction patterns simultaneously. Your primary contact at a $200,000-ARR enterprise account — typically a VP or Director — may have experienced smooth interactions. Their IT lead may have experienced four escalations over the past quarter. Your aggregate-per-account CES will blend these, masking the risk.
The practical approach: collect CES at the contact level, not just the account level, and aggregate both ways. This gives you: a per-contact CES for operational management, and a per-account weighted CES for renewal risk assessment. Where contact-level CES and account-level CES diverge — where some contacts score high and others score low within the same account — the low-scoring contact’s friction pattern often predicts renewal friction even when the primary contact is happy.
Which stakeholder’s friction matters most for retention? Gartner research and practitioner experience both point to the technical integration owner and the end-user power users — the people who interact with your product most frequently — as the most predictive of renewal decisions, even when the renewal is made by an executive who rarely contacts support.
First Contact Resolution in B2B and Its Impact on Customer Effort Score
First contact resolution CES relationship is among the most consistently supported findings in B2B service research. Organizations that improve FCR by 15% see CES improvements of 20–30% within 90 days, according to SQM Group research across B2B service organizations. FCR is the operational lever with the highest CES yield because it directly eliminates the most common friction source: repeat contacts.
In B2B multi-stakeholder accounts, measuring FCR correctly means tracking resolution across the account, not just per ticket. If the same underlying issue generates three contacts from three different stakeholders — each appearing as a “first contact” from the individual ticket perspective — your FCR metric will overstate performance while CES reveals the true friction pattern. Align your FCR and CES measurement windows to catch this.
When to Send Your CES Survey at B2B Service Journey Touchpoints
CES survey timing best practices in B2B service delivery are specific and consequential. Survey too late and you lose recency accuracy; survey too early and you interrupt the resolution experience; survey at the wrong touchpoint and you measure an interaction that doesn’t predict the outcomes you care about.
Response rates for CES surveys sent within 24 hours of a service interaction are 30–40% higher than surveys sent after 48 hours, and the quality of open-text responses correlates with recency — fresh friction is described specifically; stale friction is described vaguely or not at all.
The four key B2B service touchpoints where CES measurement is highest-value:
- Post-support ticket close — the most common CES trigger. Send within 24 hours of ticket resolution, not before. Never survey while the ticket is open.
- Post-onboarding completion — CES at onboarding end is one of the strongest predictors of 12-month retention. If onboarding scores below 5.0, early intervention reduces churn risk significantly.
- Post-contract renewal — CES at the renewal process completion measures administrative effort. High-effort renewals correlate with reduced likelihood of upsell and multi-year contract commitment.
- Post-self-service interaction — for organizations with knowledge bases or help portals, CES after a self-service attempt that escalated to human contact reveals exactly where self-service is failing.
What not to measure with CES: do not send CES surveys at account health reviews (EBRs/QBRs), during active issue escalations, or more than once per contact per 60-day window. Survey fatigue in enterprise accounts is real — one high-effort survey experience (ironically) contributes to disengagement from the measurement program itself.
CES Measurement for B2B Onboarding and Contract Renewal Touchpoints
Customer journey CES touchpoints at onboarding and renewal carry disproportionate strategic weight compared to routine support interactions. The logic is simple: these are the moments of highest emotional and financial stakes in the B2B relationship, and friction at these moments creates lasting impressions.
At onboarding: a CES score below 5.0 in the first 90 days is a reliable early warning signal. Organizations that detect and address low onboarding CES within 30 days see measurable reductions in 12-month churn. The intervention is usually straightforward — dedicated onboarding support, weekly check-ins, and proactive documentation — but it requires the CES trigger to surface the signal in time.
At renewal: friction in the renewal process — particularly in contract amendment, pricing renegotiation, and approval routing — correlates directly with the expansion revenue outcome. Enterprise accounts that score below 4.5 on renewal-process CES are 2.3× less likely to expand their contract in the 12-month post-renewal period, according to Gainsight’s 2024 State of Customer Success research. The renewal CES is not just a satisfaction metric — it is a leading indicator of your expansion ARR pipeline.
How to Reduce Customer Effort Score in Enterprise B2B Service
To reduce customer effort score in B2B service delivery, resist the instinct to frame this as a training problem. Friction is structural before it is behavioral — the most common sources of high effort (repeat contacts, channel switching, information repetition) are symptoms of process gaps, routing failures, and knowledge management breakdowns, not of agents who aren’t trying hard enough.
The foundational principle, drawn from the original CEB research: low-effort customers are 94% more likely to repurchase, 88% more likely to increase spending, and 4× less likely to churn compared to high-effort customers. The business case for effort reduction is not a CX argument — it is a revenue retention argument. Frame it as such when seeking organizational investment.
Low-Effort B2B Service Strategy for Enterprise Account Retention
Low effort customer service strategy for B2B enterprise accounts starts at the structural level — before any individual interaction takes place. The question is: what does your service architecture make easy, and what does it make hard?
Three structural interventions with the highest CES impact in B2B enterprise accounts:
- Dedicated single point of contact — enterprise accounts assigned a named CSM or support concierge experience significantly lower effort because they do not have to re-explain context at every contact. A Salesforce research study found that enterprise accounts with dedicated support contacts scored an average of 0.8 points higher on CES than accounts in pooled support models.
- Proactive SLA visibility — enterprise accounts that can see the real-time status of their service requests without contacting support experience fewer repeat contacts. Implement a customer-facing ticket portal with live status updates and expected resolution timestamps. This single change eliminates 15–20% of repeat contacts in most B2B service organizations that deploy it.
- Anticipate before they ask — identify the five most common issues your enterprise accounts face and build proactive communication around each. When a known issue arises (planned maintenance, known bug, process change), notify affected accounts before they contact you. Proactive contact, by definition, eliminates the effort of initiating contact — and its positive effect on CES is measurable within weeks.
Proactive CES Outreach and B2B Account Health Monitoring
Proactive customer effort monitoring in B2B accounts means integrating CES scores into your account health framework — not reviewing them at the end of a quarter, but triggering CSM outreach in real time when scores fall below threshold.
The mechanics: set a CES alert threshold (typically any individual account scoring below 4.0 on a single interaction, or a rolling 30-day average below 4.5). When triggered, route an automated alert to the owning CSM with the ticket context, the CES score, and the open-text response. CSM follows up within 48 hours. Customer success platforms like Gainsight and ChurnZero both support CES threshold alerts natively. If you are not on a CS platform, a Zapier workflow connecting your CES survey tool to a Slack channel or HubSpot CRM task will accomplish the same result.
CES Friction Reduction Tactics for B2B Support and Service Teams
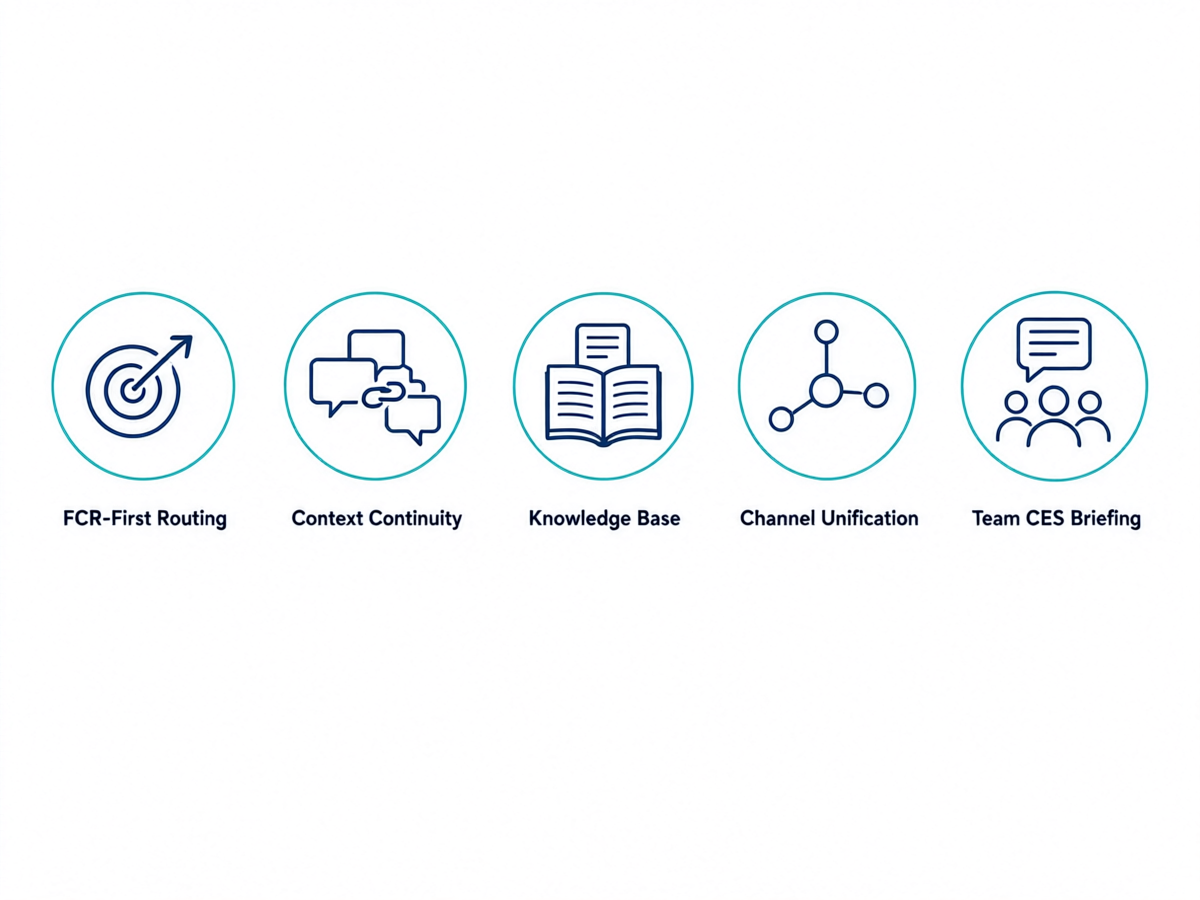
Friction reduction customer service tactics at the operational level address the interaction-by-interaction friction that structural changes cannot fully eliminate. The five highest-impact tactics for B2B support teams:
- FCR-first routing — route issues to the agent most likely to resolve them on first contact, not to the next available agent. B2B accounts are not helped by speed-to-answer if it produces repeated transfers.
- Context continuity at every handoff — implement mandatory case notes with context summary before any escalation or transfer. The customer should never have to repeat their account context. Use CRM integration to surface account history at the point of every contact.
- Knowledge base investment at friction hotspots — identify the five highest-CES-scoring issue categories from your open-text analysis. Build dedicated self-service content for each. Deflect future instances before they become contacts.
- Channel unification — for enterprise accounts that use multiple channels (email, chat, phone), ensure that case history is visible across all channels. Channel-switching friction is eliminated when the customer’s history follows them regardless of entry point.
- Brief your team on CES outcomes, not just resolution time — agents optimizing for handle time frequently increase customer effort (transferring instead of resolving, closing tickets prematurely). Share CES scores with agents weekly alongside CSAT and handle time. Make effort reduction a shared team metric, not a management dashboard metric.
CES Impact on B2B Contract Renewal and Revenue Expansion
Customer effort score retention revenue linkage is one of the clearest and most economically significant findings in B2B customer experience research, yet it remains underused in executive reporting. Most B2B service organizations report CES to their CX team. Few report it to their CFO and CRO alongside NRR and expansion ARR. That gap is a missed opportunity.
Gartner research finds that customers who rate service as “low effort” are 74% more likely to continue their relationship and 88% more likely to increase spending over the next 12 months. In B2B SaaS specifically, where net revenue retention is the benchmark financial metric, a 1-point improvement in average account-level CES (on a 7-point scale) correlates with a 6–9% improvement in 12-month NRR in organizations that have measured this relationship directly.
The silent churn problem: the most dangerous pattern in B2B CES data is accounts with consistently mediocre CES scores (4.5–5.0) that never escalate, never complain, and never produce a red flag on your churn prediction models — until they notify you of non-renewal 30 days before contract end. These accounts are not happy; they have simply stopped telling you they are not happy. CES captures their friction at the touchpoint level where NPS and CSAT miss it at the relationship level.
Connecting CES to your executive business review (QBR/EBR) process: include account-level CES trend data in your QBR template. An account whose CES has declined from 5.8 to 4.2 over the past quarter is a renewal risk conversation that should be happening at the QBR, not discovered at renewal negotiation. Your CFO will understand “our accounts scoring below 4.5 on CES have a 2.3× lower probability of expanding their contracts” far better than an abstract CX metric without revenue context.
How to Implement a CES Measurement Program in a B2B Service Organization
CES implementation B2B service teams can achieve in a structured 90-day program that moves from touchpoint definition to full deployment without requiring a major technology investment. The following roadmap is designed for teams starting from zero — no existing CES program, no dedicated CX ops team, and a realistic budget constraint.
Organizations that implement structured CES programs within 90 days of commitment see measurable CES improvement within 6 months in 78% of cases, according to Medallia’s 2025 State of CX Programs report — versus 34% improvement rates for unstructured rollouts.
Days 1–30: Foundation
- Define your two priority CES touchpoints (recommend: post-support ticket close + post-onboarding). Do not try to measure everything in Month 1.
- Select your CES survey tool (see tools section below).
- Draft your survey question using the B2B templates in Section 3.1. Get legal and brand sign-off.
- Brief your cross-functional stakeholders: CS lead, support manager, sales ops, and at least one C-suite sponsor. CES without executive ownership becomes a reporting orphan.
- Build your distribution trigger: when ticket is closed, trigger CES email within 24 hours. Set this up in your helpdesk or CES tool workflow.
Days 31–60: Pilot
- Launch CES at your post-support touchpoint only. Collect 4 weeks of data before drawing any conclusions.
- Set your baseline: segment by account tier (enterprise vs SMB), calculate CES for each. This becomes your benchmark month.
- Establish alert thresholds: any account below 4.0 on a single interaction → CSM alert within 24h. Any account averaging below 4.5 over 30 days → CSM priority review.
- Review open-text responses weekly. Identify your top three friction categories within the first two weeks.
- Share CES data in weekly support team standups. Not as a performance review — as an operational input.
Days 61–90: Expansion and Governance
- Add post-onboarding CES. Align the trigger with your onboarding completion milestone in your CRM.
- Integrate CES scores into your account health platform or CRM. CES should sit alongside open tickets, NPS score, and contract renewal date in every account view.
- Build your leadership dashboard (see reporting section below).
- Establish a quarterly CES governance review: attend with CS, support, and product leadership. Review top friction themes. Assign owners to friction reduction initiatives.
- Plan Year 1 expansion: renewal-process CES and self-service CES as Months 4–6 additions.
CES Tools for B2B Service Teams Without Enterprise Budget
Customer effort score software tools span a wide range of price points and sophistication levels. You do not need Qualtrics or Medallia to run an effective B2B CES program. The tool tiers below reflect the functional requirements of each segment:
| Tier | Tools | Best For | Key CES Feature |
|---|---|---|---|
| Enterprise | Medallia, Qualtrics XM, Sprinklr | 1,000+ account portfolios, advanced analytics, CRM integration at scale | Account-level aggregation, predictive analytics, AI friction categorization |
| Mid-Market | Delighted, AskNicely, Wootric (by InMoment) | 50–500 accounts, automated triggers, CRM integration via API | 7-point CES survey, automated trigger on ticket close, segment filtering |
| Lean / Budget | Typeform + Zapier, HubSpot Feedback Surveys, SurveyMonkey | Under 50 accounts, low volume, manual or semi-automated | Basic CES question format, webhook to CRM, manual aggregation in spreadsheet |
What to look for regardless of tier: trigger automation (survey sends without manual action on ticket close), account-level score aggregation (not just per-contact), and CRM integration so scores are visible in account context. If a tool cannot aggregate at the account level, it will not deliver the enterprise-tier CES insights you need to manage renewal risk.
CES Score Reporting for B2B Leadership Dashboards
CES reporting metrics dashboard for B2B leadership should display: (1) aggregate CES trend by month with 90-day rolling average, (2) CES segmented by account tier (enterprise vs SMB), (3) top three friction themes from open-text analysis, (4) number of accounts in alert range (below 4.5 rolling CES), and (5) closed-loop action rate — percentage of low-CES accounts where CSM outreach occurred within 48 hours.
What to avoid: a single aggregate CES number with no segmentation. Leadership dashboards that display one number hide the information that matters — which segment, which touchpoint, which friction driver. One number satisfies the metric; a segmented view drives action.
Closed-Loop CES Feedback Process for B2B Service Delivery
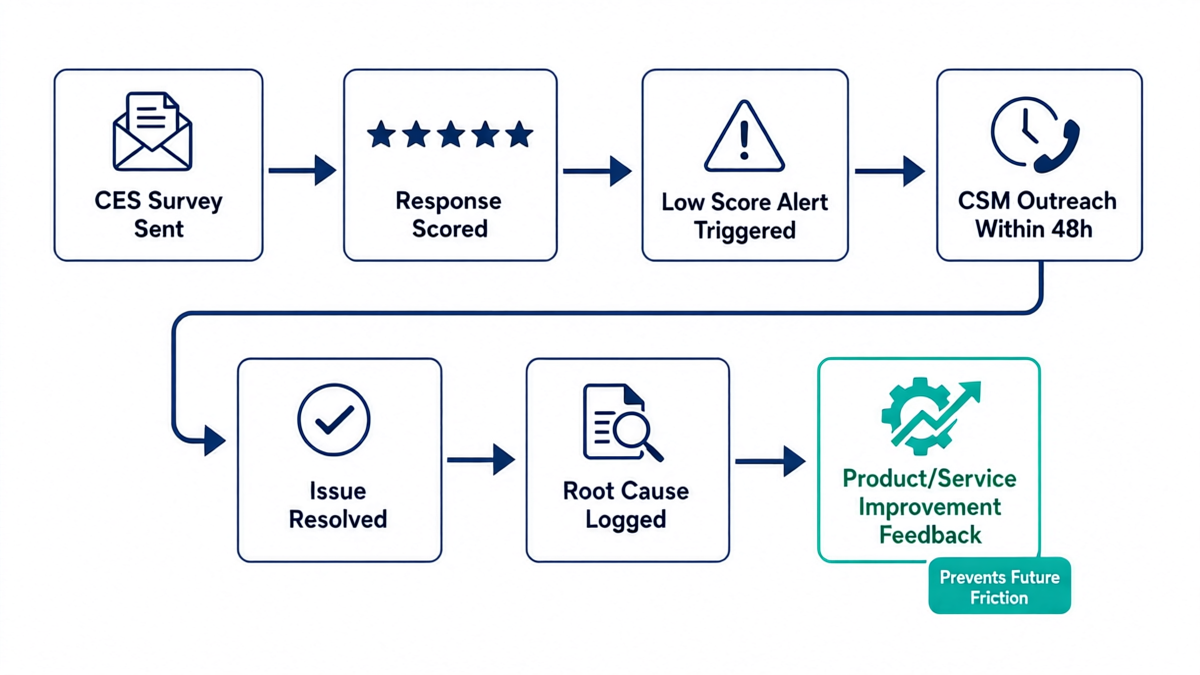
Closed loop customer feedback B2B means that no low CES score disappears into a reporting dashboard without triggering a human response. The process: CES score below threshold → automated alert to CSM → CSM contacts account within 48 hours → documents root cause of friction → resolution logged in CRM → root cause tagged and fed into monthly friction analysis → product or service improvement action assigned where pattern identified.
The closed-loop distinction that most organizations miss: closing the loop with the customer (following up) is step one, but closing the loop with the business (feeding root cause into product/process improvement) is where CES creates compounding value. The first prevents an at-risk account from churning silently. The second prevents the same friction from hitting the next 50 accounts.
Conclusion
Customer Effort Score is not a metric you should run alongside your CX program — it is the metric that makes your CX program actionable. In B2B service delivery, where the cost of friction is measured in contract values and NRR points rather than individual transactions, CES delivers what CSAT and NPS cannot: a real-time signal at the moment of truth, segmented to the account level, actionable before the renewal date.
The path forward is clear: define your two priority touchpoints, select your tool, set your baseline, establish your alert thresholds, and begin your 90-day rollout. The organizations that will differentiate in B2B service in the next three years are those building measurement and intervention systems around effort — not just satisfaction.
CES is one critical spoke in the broader customer experience operating system. For the complete framework — spanning CX strategy, measurement architecture, team design, and technology selection — explore the Customer Experience Complete Playbook. Ready to build your full CES program? That playbook is where your next step begins.
Frequently Asked Questions About Customer Effort Score in B2B Service
Is a high or low CES score better?
On the CES 2.0 agree-disagree scale (1–7), a higher score is better. A score of 7 means the customer strongly agreed it was easy to resolve their issue — the ideal outcome. A score of 1 means they strongly disagreed, indicating maximum effort. This is the opposite convention from CES 1.0 (the 2010 original), where lower scores indicated less effort. CES 2.0 is now the standard — when in doubt, check which version your tool uses. Scores above 5.5 are generally considered good in B2B contexts; below 4.5 signals material risk.
How many questions should a CES survey have?
A CES survey for B2B service interactions should have exactly two questions: the primary CES question (the agree-disagree statement about ease) and one open-text follow-up asking what could have been easier. More questions reduce response rates without proportionally increasing insight. In B2B enterprise accounts where respondents are time-constrained professionals, survey brevity directly predicts response rate — and response rate determines whether you have enough data to make segment-level decisions.
Can you benchmark CES against other companies?
You can use industry benchmark ranges as directional context, but external benchmarking has significant limits in B2B CES. Benchmark data is often self-reported, uses varying methodology (CES 1.0 vs 2.0, different scale presentations), and does not account for account mix differences between organizations. The most actionable benchmark is your own trend over time, segmented by account tier and touchpoint. If your enterprise-tier CES has improved from 4.2 to 5.1 over 6 months, that improvement trajectory is more meaningful than whether your score matches a published industry average.
How does CES predict customer loyalty?
CES predicts loyalty through the friction-disloyalty mechanism identified by Gartner’s Effortless Experience research: high-effort interactions create active disloyalty more reliably than low-effort interactions create loyalty. The asymmetry matters — eliminating effort is more effective at retaining customers than adding delight. In B2B contexts, this plays out as: accounts with consistently low CES (high effort) disengage from product expansion, reduce stakeholder engagement, and ultimately do not renew — often without explicit complaint. CES catches this disengagement signal before it becomes a lost renewal.
Does CES affect customer churn?
Yes, directly. The relationship between CES and B2B churn is one of the most consistently measured outcomes in enterprise CX research. Accounts experiencing high-effort interactions are 4× more likely to churn than accounts in low-effort relationships, and the predictive window is shorter than NPS — CES changes at the touchpoint level before relationship-level metrics shift. Organizations using CES with closed-loop alert systems report 15–25% reductions in churn among accounts that receive proactive CSM outreach following a low-CES interaction, compared to comparable accounts where the signal goes unacted upon.