Only 35% of organisations achieve their digital transformation goals (BCG, 2021). The other 65% don’t fail because they chose the wrong technology or ran out of budget — they fail, in large part, because they couldn’t measure whether their transformation was working, adjust course when it wasn’t, and prove the value to the stakeholders who controlled future funding. Digital transformation ROI is not just a reporting exercise. It is the feedback loop that keeps a transformation on track. Digital transformation KPIs, properly selected and tracked, tell you what is working, where to intervene, and what the investment is returning — before you’re too far gone to fix it.
This article gives you three things: a measurement framework built on what the evidence says about how organisations that successfully demonstrate ROI actually do it, a digital transformation ROI formula that handles both hard benefits and intangible benefits, and a phase-based measurement timeline so you know what to track and when. If you’ve been handed a transformation programme and told to prove its value, this is your starting point.
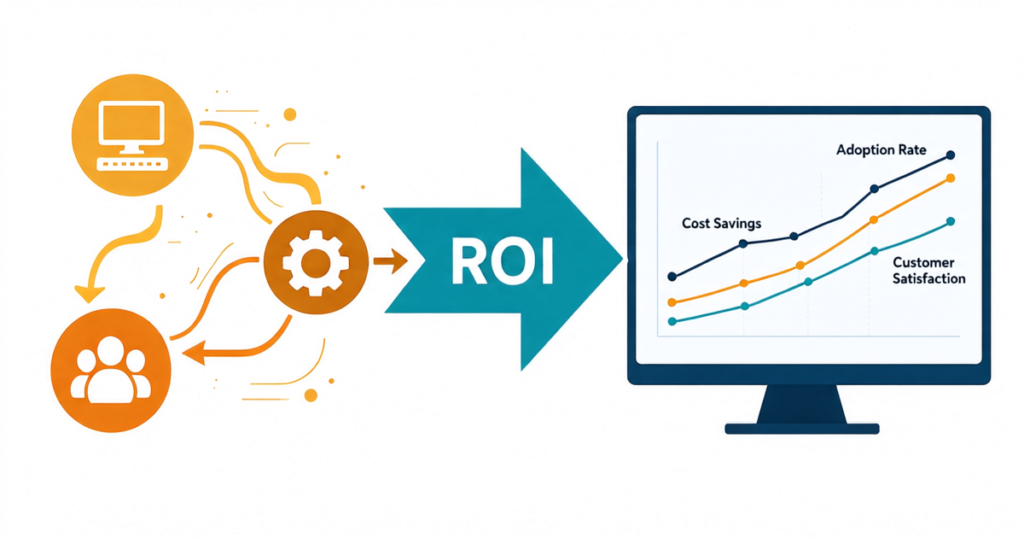
Why Most Organisations Are Measuring Their Digital Transformation ROI Wrong
Ask a room of executives how they measure their digital transformation’s ROI and the most common answer — by a significant margin — is productivity. 81% of executives use productivity as their primary ROI measure for digital transformation (Deloitte, 2023). It feels like the right answer. It’s measurable, it’s familiar, and it seems intuitively connected to the kind of process improvements transformation is meant to deliver.
The problem is that productivity is a lagging indicator — it moves slowly, it responds to multiple variables simultaneously, and it rarely isolates the impact of a specific transformation initiative. A workforce productivity uplift two years after your ERP implementation could reflect the technology, or it could reflect a new hiring cohort, a restructuring, better market conditions, or all four. You can’t disentangle transformation’s contribution from the noise.
The second measurement failure is even more common: 73% of digital transformation leaders cite inability to define exact metrics as their top measurement barrier (Deloitte, 2023). They know they should be measuring, but they haven’t established what “success” looks like in a specific, measurable way before launch. When the programme is over, they’re left with a collection of impressions and anecdotes, not a defensible ROI narrative.
The Productivity Metric Trap
Productivity fails as a primary ROI indicator not because it’s irrelevant, but because of timing and attribution. Leading indicators predict ROI before it’s visible in the P&L — they’re early signals that the transformation is taking hold and value is being built. Lagging indicators confirm ROI after the fact, when the causal window has closed and attribution is contested. Productivity is almost always lagging — by 12 to 24 months from the moment of transformation, in most programmes.
The better approach is to track leading indicators first — technology adoption rates, training completion, process cycle time at the workstream level, customer self-service completion — then use lagging indicators like productivity and operating margin to confirm and validate what the leading indicators already showed you. If you’re waiting for productivity to move before you have any ROI signal, you’ve already lost 18 months of management information.
What “All-In” Measurement Actually Means
Deloitte’s research on digital transformation measurement segments organisations into four maturity tiers: Classic (measuring primarily financial outcomes), Broad (adding operational metrics), Engaged (adding employee and customer metrics), and All-in (measuring comprehensively across all five value dimensions: Financial, Customer, Process, Workforce, and Purpose). The finding is counterintuitive but consistent: organisations that take an All-in measurement approach are 20% more likely to attribute medium-to-high enterprise value to their digital transformation than Classic organisations.
This doesn’t mean you need 46 KPIs. It means the breadth of what you measure — across financial, customer, process, and people dimensions — is itself a predictor of how much value you’ll extract and be able to demonstrate. Narrow measurement produces narrow value recognition.
The Digital Transformation ROI Formula (And How to Calculate It)
The core formula is straightforward. What makes digital transformation ROI calculation complex is not the formula itself — it’s the inputs. Specifically: what counts as “value gained,” how you handle benefits that don’t come with a price tag, and what you need to have measured before the transformation to make the calculation possible.
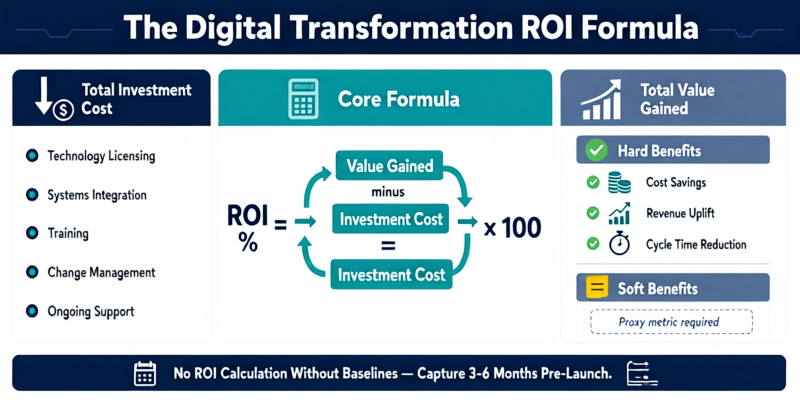
The formula: ROI = ((Total Value Gained − Total Investment Cost) / Total Investment Cost) × 100
Total Investment Cost includes: technology licensing and implementation, systems integration, change management and training, internal programme management resource, and ongoing support costs for the measurement period. Be comprehensive here — underestimating total cost is the most common reason ROI calculations collapse under CFO scrutiny.
Hard Benefits — What Goes Into “Total Value Gained”
Hard benefits are directly and unambiguously quantifiable. They fall into three categories:
Cost savings: Every manual hour eliminated has a monetary value. Calculate: (hours saved per week × cost per hour × weeks in measurement period). Include both direct labour costs and overhead allocation. If a process that required 8 hours per day now requires 2, and that staff time is verifiably redeployed rather than contracted out, you have a real cost saving.
Process cycle time reduction: (Old cycle time − New cycle time) × volume × cost per unit of processing. Example: invoice processing reduced from 5 business days to 1 day, at 1,000 invoices per month, with a processing cost of £8 per invoice-day = £32,000/month in cycle time value. Over a year: £384,000 in direct process cost reduction.
Revenue uplift: New digital channels, conversion rate improvements on existing digital journeys, or time-to-market acceleration for products released faster because of improved internal process. Use actual revenue figures from the measurement period vs. the pre-transformation baseline, controlling for market-level changes where possible.
Soft Benefits — How to Put a Number on Intangible Benefits
The reason many digital transformation ROI business cases fail to survive CFO challenge is that they include “improved employee morale” and “greater agility” as bullet points without monetary values. Soft benefits belong in the business case — but only if you can trace them to a proxy metric that translates to money.
Employee retention lift: If the transformation demonstrably improves employee satisfaction with tools (measurable via eNPS or pulse survey), and you can show a reduction in voluntary turnover among affected employee groups, the monetary value is real. Average replacement cost of a knowledge worker is typically 1.5 to 2 times annual salary. A 3% reduction in voluntary turnover across a 200-person team has a quantifiable cost-avoidance value.
Business agility: If time-to-market for a product category improves because underlying processes are digitised and automated, assign the revenue value of a product launched 6 weeks earlier. This requires historical data on product revenue ramp curves, but is defensible.
Risk reduction: Probability × impact. If a compliance automation removes a process failure risk that historically resulted in regulatory fines of £150,000, and the risk probability reduces from 15% to 2%, the expected value of risk reduction is (0.15 − 0.02) × £150,000 = £19,500/year.
The rule for soft benefits: include only those you can trace to a proxy metric. Do not include “brand reputation” unless you can show NPS lift × customer lifetime value change. Sentiment without a number is advocacy, not a business case.
Setting Baselines Before You Launch
There is no ROI calculation without pre-transformation baseline metrics. This sounds obvious — and yet the most common structural failure in transformation ROI measurement is that baselines are captured at go-live (or after), when the data is already contaminated by early adoption behaviour.
Minimum baseline data set, captured 3–6 months before go-live: process cycle time for all in-scope processes, error and rework rate, cost per transaction or per process cycle, customer satisfaction score (CSAT) and Net Promoter Score (NPS) for affected customer journeys, headcount deployed in in-scope processes, and technology adoption rate for legacy systems being replaced. Document these in a formal baseline register. Your post-transformation measurement will be compared against this register — not against memory, not against anecdote.
The Digital Transformation KPIs Framework: What to Measure Across Four Dimensions
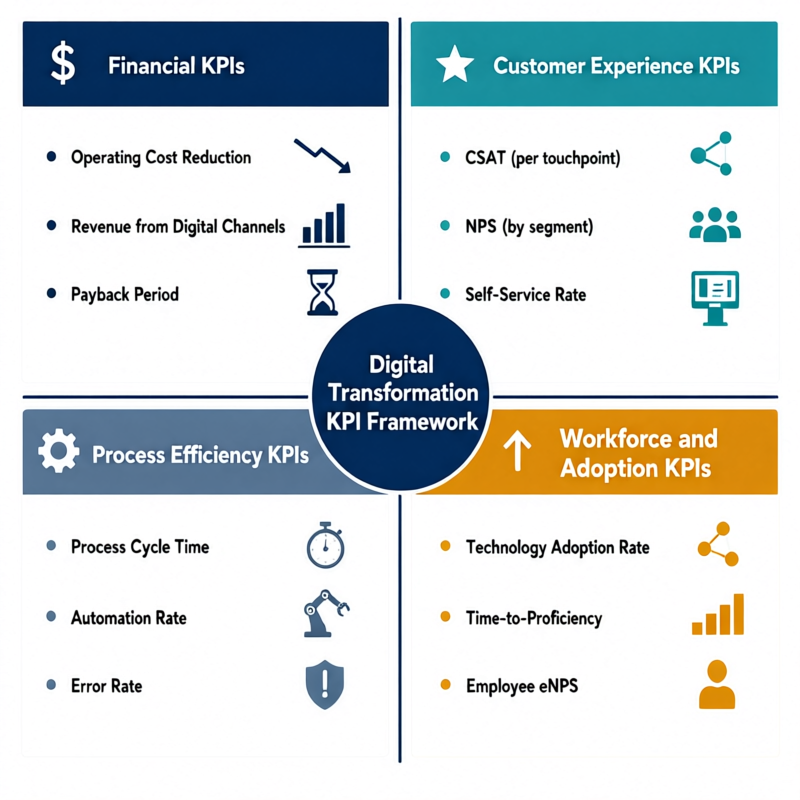
The Deloitte research identified 46 digital transformation value KPIs across five dimensions. You don’t need all 46. What you need is intentional coverage across the four primary dimensions — Financial, Customer Experience, Process Efficiency, and Workforce/Adoption — because organisations that measure only one or two dimensions systematically undercount the value their transformation is generating. Digital transformation KPIs are not just a reporting tool; they are a value discovery tool. If you’re not measuring a dimension, you’re not seeing the value it produces.
Financial KPIs
Financial performance metrics are the language of CFO sign-off. Every transformation programme needs at least three:
| KPI | What It Measures | Measurement Approach |
|---|---|---|
| Operating cost reduction | % reduction in cost per transaction or process unit vs. baseline | Cost per process unit (pre) vs. cost per process unit (post); normalise for volume changes |
| Revenue from new digital channels | % of total revenue attributable to newly created digital touchpoints or channels | Track channel-level revenue in CRM/analytics; separate from pre-existing digital revenue |
| Budget vs. actual cost | Programme financial control — is the transformation itself delivering cost discipline? | Monthly programme cost tracking vs. approved budget; report variance ±10% as trigger |
| Operating margin | Long-term financial performance improvement attributable to transformation | 12–24 month lag; compare margin trend to sector benchmark to control for market effects |
| Payback period | Months to recover total transformation investment from cumulative hard benefits | Cumulative hard benefit value ÷ monthly hard benefit run rate = months to payback |
Customer Experience KPIs
McKinsey’s research on digital CX transformation is the clearest evidence for the financial return from customer-focused metrics: organisations that digitise customer journeys see 20–30% increases in customer satisfaction and 20–50% economic gains (McKinsey, 2019). The key is measuring at the touchpoint level, not organisation-wide averages.
| KPI | What It Measures | Measurement Approach |
|---|---|---|
| CSAT (per transformed touchpoint) | Customer satisfaction at specific digitised interactions | Post-interaction survey, 1–5 scale; track cohort of transformed touchpoints vs. control |
| NPS (by customer segment) | Relationship-level loyalty signal | Segment by customers who interact primarily via new digital channels vs. legacy channels |
| Customer Effort Score (CES) | Ease of completing a task post-transformation | Post-interaction survey: “How easy was it to [complete task]?” 1–7 scale; compare to baseline |
| Self-service completion rate | % of customer requests completed without agent intervention | Track via service platform; the financial corollary: each 1% shift to self-service reduces cost-to-serve by approximately 25–35% |
| Customer time-to-value | Time from initial engagement to first meaningful value delivery (onboarding, first order, first resolution) | Track in CRM from first touchpoint to first value event; compare pre/post transformation |
Process Efficiency KPIs
Process KPIs are where transformation impact is most visible — and most immediately measurable. Nearly three-quarters of organisations now report that their most advanced AI and automation initiatives are meeting or exceeding ROI expectations (Deloitte, 2025), and process efficiency metrics are where that ROI shows up first.
| KPI | What It Measures | Measurement Approach |
|---|---|---|
| Process cycle time | End-to-end time for key business processes | Time-stamp at process start and end in the new system; compare to baseline register |
| Automation rate | % of previously manual process steps now executed automatically | Identify all decision points and handoffs in pre-transformation process map; count automated vs. remaining manual |
| Error and rework rate | % of outputs requiring correction or reprocessing | Track exceptions and corrections in the process system; compare to baseline error log |
| First-contact resolution (FCR) | % of customer contacts resolved on first interaction (service processes) | Flag resolved vs. escalated/repeated contacts in service platform; track weekly |
| Process cost per unit | Total operating cost of a process divided by volume processed | Allocate direct and overhead costs to process; divide by monthly volume; compare quarterly |
Workforce and Adoption KPIs
Workforce and adoption KPIs are the most important leading indicators in any transformation measurement framework — they predict whether financial ROI will materialise before the financial metrics move. If adoption is at 40% at 90 days post-go-live, your financial ROI at month 12 will be approximately 40% of plan. The signal is that early.
| KPI | What It Measures | Target / Benchmark |
|---|---|---|
| Technology adoption rate | % of target users actively using the new system (weekly active users) | Target: 80%+ within 90 days of go-live; 90%+ by day 180 |
| Time-to-proficiency | Days from system access to full productive use (output at pre-transformation level) | Benchmark: 30 days for simple systems; 60–90 days for complex ERP/CRM platforms |
| Employee productivity index | Output per employee vs. pre-transformation baseline | Lagging — expect 3–6 months to stabilise post-go-live; dip then recovery is normal |
| Employee NPS on digital tools (eNPS) | Employee satisfaction with the new technology | Measure at 30/60/90 days; sustained eNPS uplift predicts retention and productivity gains |
| Training completion rate | % of in-scope employees who have completed required training modules | Leading indicator: 100% before go-live for critical roles; track by department to find adoption risks |
When to Measure What — A Phase-Based Measurement Timeline
One of the most common stakeholder management failures in digital transformation is reporting the wrong metrics at the wrong time. If you’re presenting NPS data at month two of a deployment that’s still in active adoption phase, you’re presenting noise — and your leadership team will lose confidence in the measurement framework before it’s had a chance to tell you anything real. Measuring digital transformation impact requires a phase-sensitive approach: the right metrics for the right moment in the transformation lifecycle.
Phase 1 — Baseline and Pre-Launch Measurement (Months −6 to 0)
Measurement before go-live is not optional — it’s the foundation of every calculation that follows. Capture your complete baseline register: all process cycle times, error rates, cost-per-unit figures, CSAT and NPS scores for in-scope journeys, headcount deployed in affected processes, and adoption metrics for legacy systems being replaced.
Common mistake: capturing baselines in the final week before go-live, when teams are in heightened awareness of impending change and behaviour is already shifting. The stable baseline is a 3-month average from a “normal operating” period — at least 3 months before any major pre-launch change management activity begins. Document everything in a formal baseline register with data source, date range, and owner.
Phase 2 — Implementation and Adoption Measurement (Months 1–4)
During active implementation and the first 90 days post-go-live, only leading indicators should be on your executive dashboard. Technology adoption rate, training completion rate, time-to-proficiency, and process cycle time at the workstream level (which will initially deteriorate, then recover, then improve) are what tell you whether the transformation is taking root.
What you should not report during Phase 2: P&L-level financial KPIs, NPS, or productivity indices. These will not have moved — and if they have, it’s noise from go-live disruption, not signal from transformation value. Setting the expectation with leadership that financial KPIs are Phase 3 metrics is a critical piece of stakeholder management. Document this expectation before launch.
Phase 3 — Value Realisation Measurement (Months 5–24+)
Value realisation begins when technology adoption reaches approximately 80% and has been sustained for 60 days. At this point, process KPIs should be showing measurable improvement over baseline, and customer experience metrics should be moving. Financial KPIs follow, typically 6–12 months post-go-live for operational metrics (cost per unit, process cycle time cost) and 12–24 months for P&L-level metrics (operating margin, revenue attribution).
Set a quarterly measurement cadence in Phase 3: calculate ROI against the formula at each quarter, compare to the projected ROI curve from your business case, and identify any dimensions where expected value hasn’t materialised. Undelivered KPI movement is a management action trigger — not a retrospective finding.
How to Present Digital Transformation ROI to Your Board
69% of technology leaders say they struggle to effectively explain the value of technology transformation to their board and executive leadership (KPMG, 2023). The failure mode is almost always the same: too many metrics, too much operational detail, and no clear translation to the financial and strategic outcomes the board cares about.
What Boards Actually Want to See
Board members are not evaluating your KPI methodology. They are making one decision: is this investment delivering on its strategic rationale, and should we continue to fund it? Answer that decision directly, in the format they use to evaluate all investments.
The board-ready digital transformation ROI summary contains three elements: (1) Investment summary — total spend to date vs. approved budget and forecast, with no technical breakdown; (2) Value realised — total hard benefits measured to date, in £/$ terms, against the business case projection; and (3) Trend — two lagging indicators that connect to board-level strategic goals, shown as trend lines over 12 months with a 6-month forward projection.
Everything else belongs in a management dashboard, not the board pack. If a board member asks for more detail, that’s a success signal — not a prompt to pre-load the pack with everything you know.
The ROI Narrative Structure
The narrative that accompanies your metrics matters as much as the metrics themselves. Structure it in three parts: Context (what we invested in and why — tied to the specific strategic objective this board approved), Progress (what has changed — in before/after terms, not index points), and Trajectory (when full value realisation is expected and what it will look like in revenue or cost terms).
Use one industry benchmark to contextualise your progress. Against the backdrop of a sector where only 35% of transformation programmes achieve their goals (BCG, 2021), a programme that is tracking 90 days ahead of its adoption curve is a genuinely positive story — but only if you give the board the benchmark to understand what “ahead of plan” means.
Language matters. “Our Customer Effort Score improved from 4.1 to 3.6” means nothing to most board members. “Customers are resolving their issues with 12% less effort, and self-service completion is up 18 percentage points — reducing our cost-to-serve by an estimated £280,000 annually” is a business outcome. Always translate metrics to outcomes.
A Digital Transformation ROI Measurement Checklist
Measuring digital transformation ROI properly is a discipline, not a one-off exercise. The following checklist covers the minimum requirements for a measurement framework that can survive CFO challenge, drive management decisions, and tell the story your board needs to hear. Use it before launch, during, and after to ensure your programme’s digital transformation KPIs are working as hard as the transformation itself.
Before Launch — Baselines
Baseline register captured 3–6 months pre-go-live (process cycle times, cost per unit, CSAT, NPS, error rates, headcount)
Baseline data source and date range documented with owner sign-off
ROI formula applied to business case — total investment cost fully accounted (tech, integration, training, change management)
ROI Formula — Applied
Hard benefits identified and monetised (cost savings, revenue uplift, cycle time reduction)
Soft benefits included only where a proxy metric and monetary value can be assigned
Payback period calculated and communicated to stakeholders pre-launch
KPI Framework — Four Dimensions
At least 2 Financial KPIs selected and baselined
At least 2 Customer Experience KPIs selected and baselined (at touchpoint level, not org-wide averages)
At least 2 Process Efficiency KPIs selected and baselined
At least 2 Workforce/Adoption KPIs identified as leading indicators for Phase 2 reporting
Phase-Based Measurement — Timeline in Place
Phase 2 (adoption) and Phase 3 (value realisation) measurement calendars documented
Stakeholders aligned on which KPIs are reported in which phase (avoid premature lagging indicator reporting)
Board Reporting — Format Ready
Board-ready summary format defined: investment vs. budget, hard benefit value realised, 2 strategic KPI trend lines
ROI narrative drafted in Context / Progress / Trajectory structure
Frequently Asked Questions
Q1. How do you calculate ROI on digital transformation?
The core formula is: ROI = ((Total Value Gained − Total Investment Cost) / Total Investment Cost) × 100. Total Investment Cost must be comprehensive — technology licensing, integration, training, change management, and ongoing support. Total Value Gained splits into hard benefits (cost savings, revenue uplift, cycle time reduction — all directly monetisable) and soft benefits (employee retention, business agility, risk reduction — included only when traceable to a proxy metric). The critical prerequisite: you need a pre-transformation baseline for every metric you plan to include in the calculation, captured at least 3 months before go-live.
Q2. What are the most important KPIs for digital transformation?
The most important digital transformation KPIs are spread across four dimensions — Financial, Customer Experience, Process Efficiency, and Workforce/Adoption — because value in a transformation rarely concentrates in just one area. In the early phase (first 90 days), adoption rate and time-to-proficiency are the most important: they are leading indicators that predict whether financial ROI will materialise. In the value realisation phase, process cycle time, operating cost reduction, and CSAT at the touchpoint level are the primary signals. Deloitte’s research shows that organisations measuring KPIs across all four dimensions are 20% more likely to report high enterprise value from their transformation than those measuring only one or two dimensions.
Q3. What is a good ROI for digital transformation?
There is no universal benchmark for a “good” digital transformation ROI, but industry analyses typically show that well-executed programmes return 2:1 to 5:1 over a 3-year measurement period — meaning every £1 invested generates £2–£5 in value. Process automation and customer experience transformations tend to deliver ROI faster than platform or infrastructure transformations, which often have longer payback periods of 18–36 months before positive returns emerge. A more useful benchmark than a universal ROI target is your own business case projection: a transformation that delivers within 15% of its projected ROI on the agreed timeline is performing well, regardless of the absolute figure.
Q4. How long does it take to see ROI from digital transformation?
The timeline for visible ROI from digital transformation follows a phased pattern. Process efficiency metrics (cycle time, error rate, automation rate) typically show improvement within 3–6 months of reaching 80% user adoption. Customer experience metrics (CSAT, NPS at the touchpoint level) usually move within 6–9 months. Financial and P&L-level metrics — operating margin, revenue growth — typically take 12–24 months to show measurable, attributable improvement. The most common timeline management failure is expecting financial ROI in the first 90 days, when only adoption and process leading indicators are available and meaningful.
Q5. What percentage of digital transformation projects fail to deliver ROI?
Only 35% of organisations achieve their digital transformation goals (BCG, 2021), which means approximately 65% fail to deliver the intended value. However, “fail” encompasses a wide range of outcomes — from complete project collapse to programmes that delivered partial value but couldn’t demonstrate or capture it due to poor measurement. McKinsey research shows significant variance by industry: high-tech sector transformations achieve success rates around 26%, while traditional industries such as oil and gas and automotive see only 4–11% success rates. The single most common factor separating successful from unsuccessful programmes is not technology choice — it is whether the organisation had a measurement framework in place before launch.
Q6. What metrics do CEOs and CIOs use to measure digital transformation?
McKinsey’s research on what senior leaders use to measure digital transformation identifies five primary metrics: revenue growth attributable to digital channels, operating cost reduction from automation and process improvement, customer satisfaction (measured at the journey level, not organisation-wide), technology adoption rate, and speed of product or service delivery to market. CEOs tend to focus on the first and third; CIOs focus on the fourth and fifth. The shared metric that both care about — and that the CFO controls — is the operating cost reduction figure, which is also the metric most likely to determine whether the transformation gets further investment in its next phase.
Q7. How do you measure the intangible benefits of digital transformation?
Intangible benefits become measurable when you attach them to proxy metrics that have a quantifiable monetary value. Employee morale improvement becomes measurable as a voluntary turnover reduction (at 1.5–2× salary as replacement cost). Business agility becomes measurable as a reduction in time-to-market, which can be valued by applying historical revenue ramp data to the weeks gained. Risk reduction becomes measurable via a probability-times-impact calculation on the specific risks the transformation mitigates. The discipline required is not to include any intangible benefit you can’t trace to a proxy metric — “improved brand reputation” without an NPS-to-CLV conversion is not a business case input, it’s advocacy.
Q8. What is the difference between digital transformation ROI and traditional project ROI?
Traditional project ROI is typically calculated over a fixed delivery window — the project ends, the cost is known, and the output is measurable. Digital transformation ROI is fundamentally different because the programme creates ongoing capability changes rather than a single deliverable, value realises over years rather than at project close, and the measurement requires continuous rather than one-time tracking. A second key difference is attribution: traditional project ROI can usually be isolated, while transformation ROI requires controlling for market and organisational variables that move simultaneously. This is why the Deloitte “All-in” measurement approach — tracking multiple dimensions continuously — is more effective than point-in-time project-style ROI calculations.
Q9. How do you set baseline metrics for a digital transformation programme?
Setting baselines for a digital transformation programme requires five steps: identify the processes, journeys, and capabilities the transformation will change; for each, identify the specific metric that would show improvement; capture a 3-month average of that metric from normal operating data (at least 3 months before go-live, not immediately before); document each baseline with data source, date range, calculation method, and owner; and store all baselines in a formal baseline register that will be used for post-implementation ROI calculation. The most common baseline error is capturing data in the period immediately before launch, when teams are in heightened awareness of change and behaviour is already shifting from normal patterns.
Q10. What is the ROI formula for digital transformation?
The digital transformation ROI formula is: ROI (%) = ((Total Value Gained − Total Investment Cost) / Total Investment Cost) × 100. Total Investment Cost should include all programme costs — technology, integration, training, change management, ongoing support — not just software licence fees. Total Value Gained is the sum of all hard benefits (cost savings, revenue uplift, process efficiency gains, all in monetary terms) plus soft benefits that are traceable to a proxy metric. To produce a meaningful result, every variable in the formula must be compared against a pre-transformation baseline captured before go-live. Without that baseline, the calculation produces a number but not a defensible ROI.
Q11. How do digital transformation KPIs differ from traditional IT project KPIs?
Traditional IT project KPIs focus on delivery: on time, on budget, defect-free, system uptime. Digital transformation KPIs focus on business outcome: did the transformation change how the organisation performs for customers, employees, and the P&L? This distinction matters practically: a digital transformation that delivered on every IT KPI — on time, on budget, zero defects — can still fail to deliver ROI if adoption is low, processes haven’t changed, and customers haven’t noticed a difference. The shift from tracking delivery KPIs to business outcome KPIs is one of the most significant capability gaps in organisations starting their first major transformation programme.
Q12. What role does change management play in digital transformation ROI?
Change management is the primary lever for the adoption KPIs that predict financial ROI. A technology adoption rate of 40% at day 90 — which is what organisations with weak change management programmes typically see — means you are capturing approximately 40% of the ROI your transformation was designed to deliver. The investment in change management (communications, training, super-user networks, leadership sponsorship) directly determines how quickly the adoption curve reaches 80%+ and how long it stays there. Organisations that treat change management as a cost to minimise rather than an ROI accelerator consistently underperform their transformation business cases.